
- ETH compresses above $1,885 as volatility tightens across futures markets
- Open interest resets to $23B, reducing systemic leverage risk
- Spot flows stabilize while macro investors rebalance exposure
Ethereum trades inside a tightening range as derivatives leverage resets and spot flows stabilize near key support. On the four-hour chart, ETH holds above $1,885 after a sharp rejection from the $3,400 macro top.
Price retraced through the 0.618 and 0.5 Fibonacci levels before consolidating near the lower cluster. Consequently, traders now watch for a decisive move as volatility compresses and positioning thins across futures markets.
Technical Structure Signals Compression
ETH rebounded from the $1,746 swing low, which aligns with the 0.0 Fibonacci level. Since then, price has hovered between $1,885 and $1,960.
However, the 0.236 retracement at $2,137 caps upside attempts. The 20-period Bollinger Bands have tightened, reflecting reduced volatility. Price sits near the mid-band, showing neutral short-term momentum.
Moreover, the Chaikin Money Flow reads near 0.02, indicating mild capital inflows. Buyers have not shown aggressive accumulation yet.
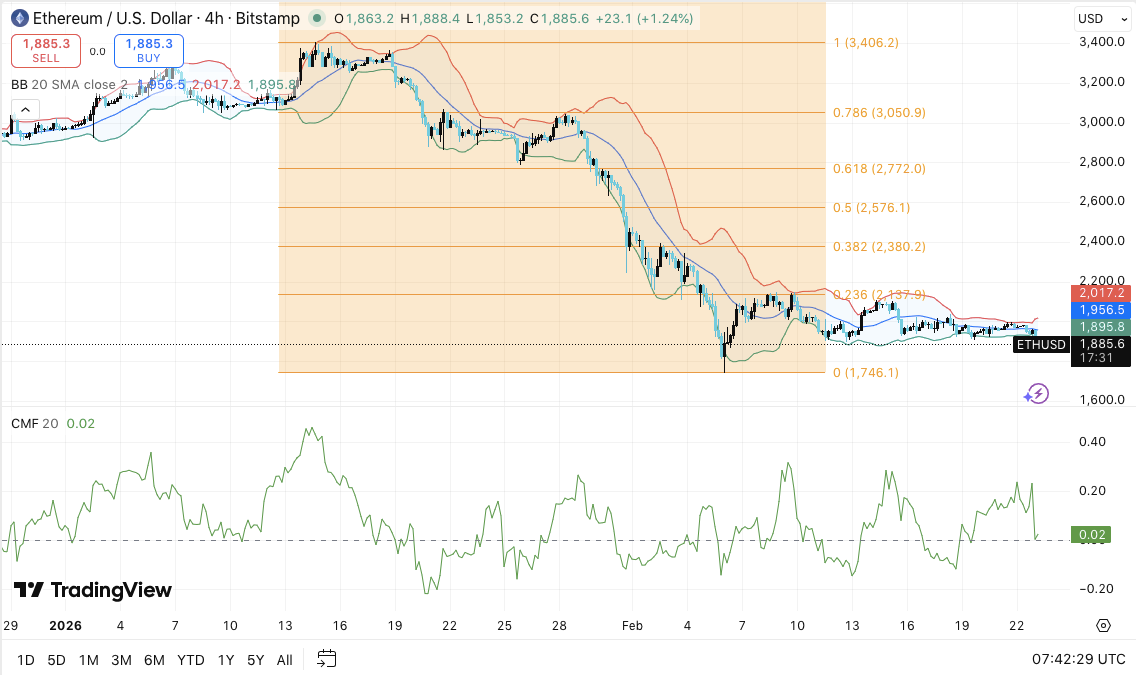
Immediate resistance stands between $1,956 and $2,017. A sustained push above this zone could open room toward $2,137. If bulls clear that level, $2,380 becomes the next recovery target.
Related: XRP Price Prediction: Bulls Eye $1.47 Reclaim After Historic Loss Spike
On the downside, $1,885 remains the range base. A break below this floor increases the probability of a retest toward $1,746. Losing that swing low would expose broader macro weakness.
Open Interest Reset Reduces Excess Risk
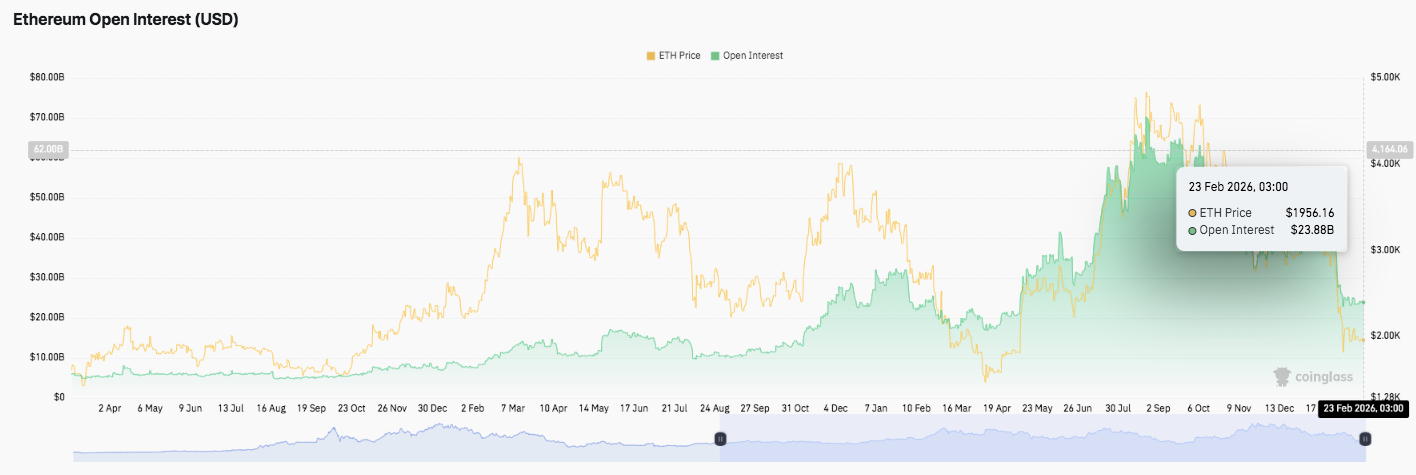
Ethereum’s open interest tells a separate story about leverage conditions. Earlier in the cycle, positioning stayed below $15 billion. As price momentum strengthened, open interest climbed toward $35 billion. Significantly, the late rally pushed exposure beyond $60 billion, reflecting heavy speculative activity.
However, volatility quickly reversed the buildup. Open interest fell sharply as liquidations and position closures accelerated. The latest reading near $23–$25 billion suggests leverage has normalized. Hence, derivatives markets now show reduced systemic risk compared to the peak frenzy.
Spot Flows Stabilize as Hayes Diversifies
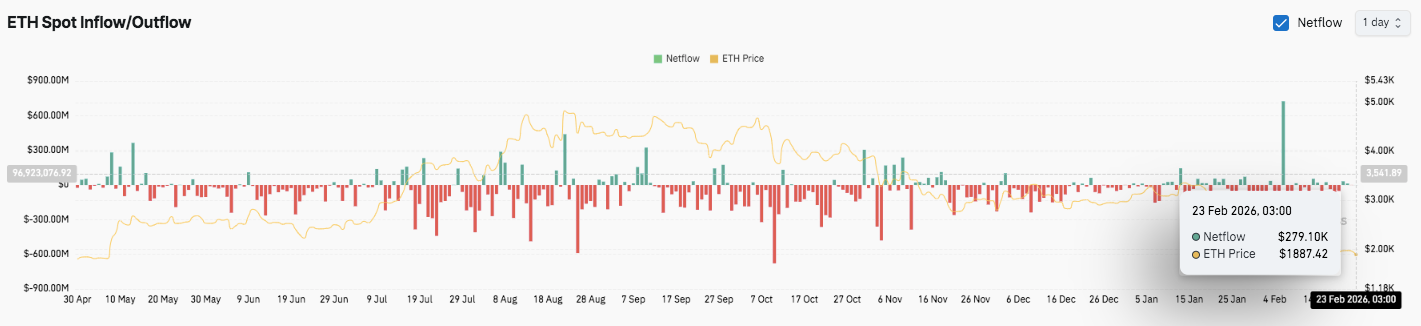
Spot flow data shows months of distribution between mid-July and October. Several sessions recorded outflows exceeding $500 million during sharp pullbacks. Besides, early October marked one of the deepest net outflow events.
From late November onward, flows began stabilizing. February reflects mixed activity, with modest inflows and one large spike above $600 million. The latest netflow reading near $279,000 suggests balanced positioning.
Related: PIPPIN Price Prediction: Bulls Defend $0.64 as Open Interest Rebuilds
Meanwhile, BitMEX co-founder Arthur Hayes revealed a diversified portfolio spanning gold, uranium, oil majors, defense equities, and core cryptocurrencies such as Bitcoin and Ethereum.
Additionally, he holds exposure to Zcash and the DeFi token HYPE. Analysts view this allocation as rooted in commodity cycles and geopolitical themes. Consequently, ETH trades within a corrective phase while macro investors balance digital assets against tangible resource exposure.
Technical Outlook for Ethereum (ETH) Price
Key levels remain clearly defined as Ethereum consolidates beneath macro resistance. On the 4-hour chart, ETH trades inside a corrective range after rejecting from the $3,400 top. Price now fluctuates between $1,885 and $1,960, showing short-term compression.
Upside levels: $1,956–$2,017 serve as immediate hurdles near the Bollinger mid-to-upper band cluster. A sustained push above this range could open the path toward $2,137, the 0.236 Fibonacci retracement. If bulls reclaim $2,137, momentum may extend toward $2,380, aligning with the 0.382 Fib zone.
Downside levels: $1,885 marks the current range floor and short-term demand zone. Below that, $1,746 stands as the major swing low and structural support. A break under $1,746 would confirm broader macro weakness and expose lower retracement targets.
Resistance ceiling: $2,137 remains the key level to flip for medium-term bullish continuation. Reclaiming this level would signal recovery strength and renewed upside participation.
The technical structure suggests Ethereum is compressing after a deleveraging phase. Open interest has reset near $23–$25 billion, reducing excess risk. Meanwhile, spot flows show stabilization after months of distribution.
Will Ethereum Go Up?
Ethereum’s next move hinges on whether buyers can defend $1,885 long enough to challenge the $1,956–$2,017 cluster. Stronger inflows and rising open interest would support a recovery toward $2,137 and possibly $2,380.
However, failure to hold $1,885 increases the probability of a retest of $1,746. For now, ETH remains in a decisive range, where compression often precedes volatility expansion.
Related: Solana Price Prediction: Can SOL Hold $67.38 As Open Interest Falls 2.05%?
Disclaimer: The information presented in this article is for informational and educational purposes only. The article does not constitute financial advice or advice of any kind. Coin Edition is not responsible for any losses incurred as a result of the utilization of content, products, or services mentioned. Readers are advised to exercise caution before taking any action related to the company.


