
- ETH trades $1,890–$1,954, with a breakout likely defining the next move.
- Open interest fell to $23B, signaling reduced leverage and lower short-term volatility.
- Vitalik emphasizes resilient DeFi, boosting long-term confidence despite range-bound price.
Ethereum trades in a tight range after rebounding from sharp losses near the $1,800 level. The 1-hour chart shows a corrective bounce from the Fibonacci base around $1,801. Price reclaimed short-term moving averages, yet the broader trend still reflects lower highs from the $2,100 zone. Consequently, sellers maintain medium-term control despite the recent recovery.
Key Levels Define Short-Term Direction
In the near term, $1,890 to $1,900 serves as immediate support. This zone aligns with recent consolidation and minor EMA clustering.
Below that, $1,877 near the 0.236 Fibonacci level becomes critical. A break under $1,877 may reopen pressure toward $1,840 and $1,801. If $1,801 fails, bearish momentum could accelerate quickly.
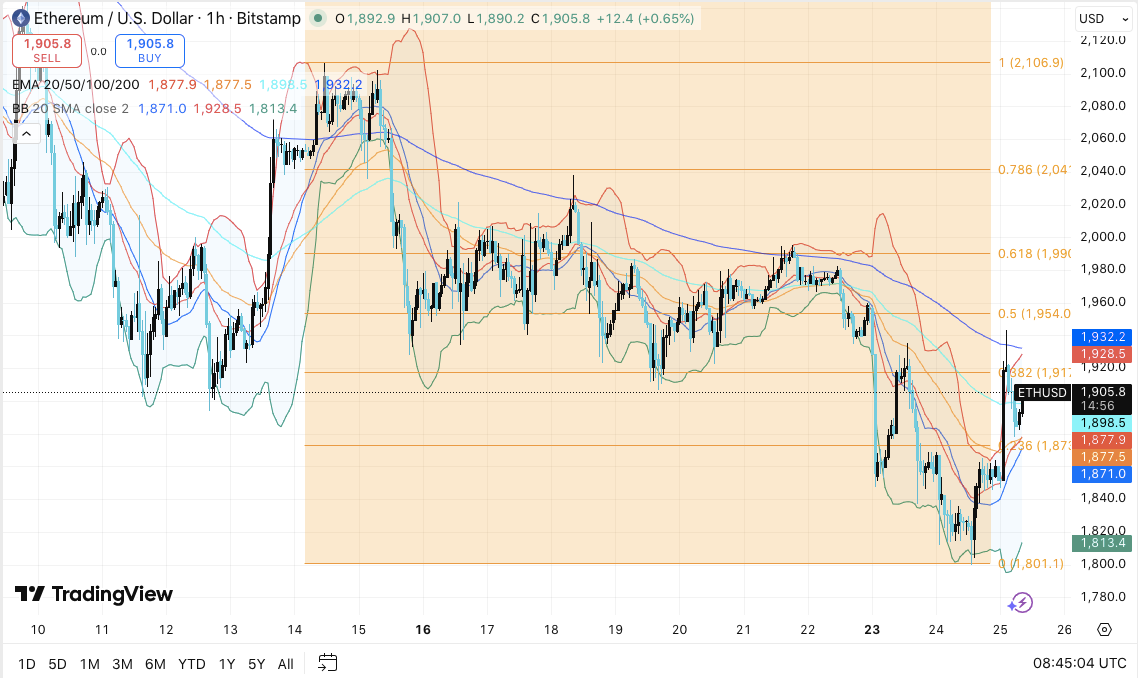
On the upside, $1,917 at the 0.382 retracement acts as first resistance. Additionally, $1,954 at the 0.5 level forms a stronger barrier. A decisive push above $1,990 near the 0.618 retracement would shift short-term momentum.
Related: Espresso Price Prediction: ESP Futures Open Interest Jumps 4× in One Week After Dual Listings
Hence, bulls could target $2,040 at the 0.786 level. However, $2,100 remains the major ceiling for any sustained breakout.
Currently, price trades between $1,890 support and $1,954 resistance. Therefore, a range breakout will likely determine the next directional move.
Open Interest Contracts as Leverage Cools
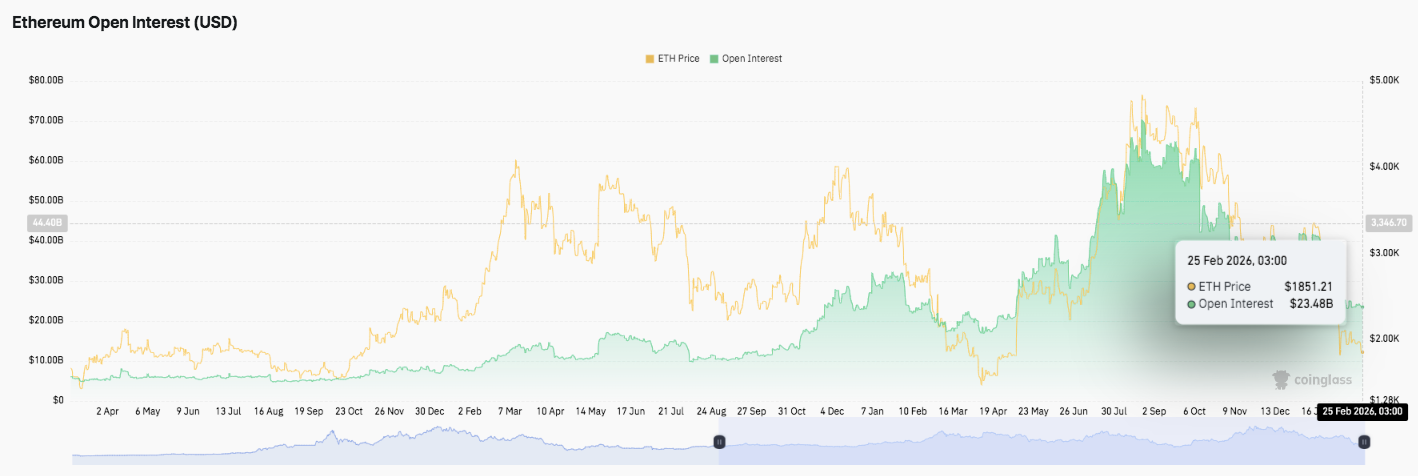
Ethereum open interest shows a clear expansion followed by a sharp contraction into late February. During the prior rally, open interest climbed steadily as price advanced toward local highs. Significantly, the mid-year breakout pushed open interest above $60 billion, reflecting heavy leverage.
However, as price momentum weakened, open interest declined rapidly. This drop indicates long liquidations and broad position unwinding.
The recent fall toward $23 billion suggests traders reduced risk exposure across derivatives markets. Consequently, the structure reflects a leverage flush after a crowded bullish phase. Lower leverage may now reduce volatility risk in the short term.
Spot Flows Improve as Foundation Pushes DeFi Vision
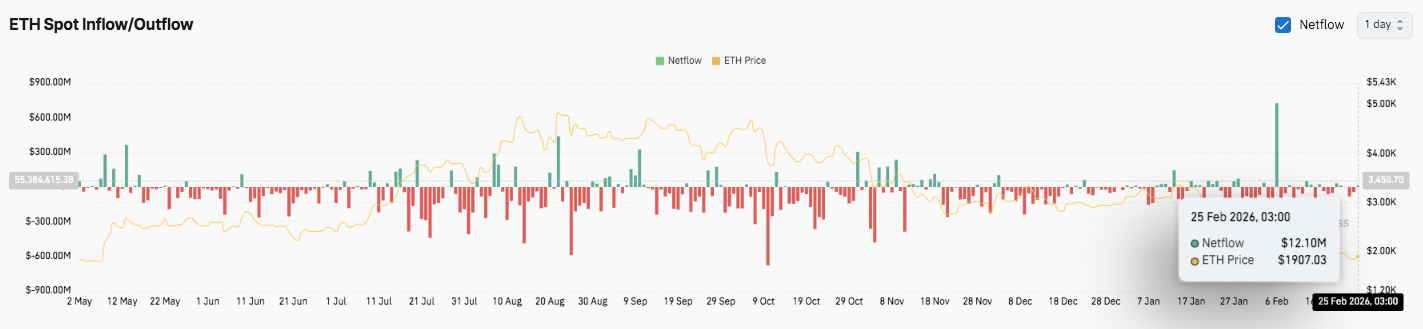
Spot flow data reveals persistent volatility, with heavy exchange deposits during prior declines. Several deep red spikes aligned with distribution phases and price weakness.
However, recent sessions show smaller net outflows and occasional green surges. Additionally, a strong late-February inflow suggests renewed buying interest near stabilization levels.
Related: Solana Price Prediction: $3.78M ETF Inflows Support Bounce Toward $90
Meanwhile, Vitalik Buterin and the Ethereum Foundation reaffirm support for permissionless decentralized finance. Buterin emphasized global, open, and security-focused financial systems that reduce centralized control.
Moreover, he encouraged developers to build resilient protocols that function independently of founding teams. This renewed commitment to foundational DeFi principles may strengthen long-term confidence even as short-term price remains range-bound.
Technical Outlook For Ethereum (ETH) Price
Key levels remain clearly defined as Ethereum trades inside a tightening short-term range.
Upside levels: $1,917, $1,954, and $1,990 stand as immediate resistance barriers. A confirmed breakout above $1,990 could open the path toward $2,040 and potentially $2,100. The $2,100 region remains the major resistance ceiling and defines the broader trend cap. A sustained move above that level would shift medium-term momentum firmly bullish.
Downside levels: $1,890 serves as immediate support, followed by $1,877 near the 0.236 Fibonacci region. A break below $1,877 could expose $1,840. If selling pressure intensifies, price may revisit the $1,801 base. That level marks the recent swing low and a critical structural floor.
The technical structure shows Ethereum recovering after a sharp correction from the $2,100 area. However, the broader pattern still reflects lower highs, which signals that sellers maintain medium-term control. Price currently compresses between $1,890 support and $1,954 resistance. This narrowing range suggests a volatility expansion may follow.
The 200-day EMA near the $2,000 region remains a key pivot for sentiment. A decisive reclaim of that zone would strengthen bullish conviction. Until then, rallies may face supply pressure.
Will Ethereum Go Up?
Ethereum’s near-term direction depends on whether buyers can defend $1,890 while building momentum toward the $1,954–$1,990 resistance cluster. Strengthening spot inflows and stabilizing open interest could support an upside attempt.
However, failure to hold $1,877 would weaken the short-term structure and raise the risk of a retest of $1,801. For now, Ethereum trades in a pivotal zone. The next breakout will likely determine whether ETH targets $2,040 or revisits lower demand levels.
Related: Enso Price Prediction: Bulls Target $5 After CCIP Catalyst Ignites Breakout
Disclaimer: The information presented in this article is for informational and educational purposes only. The article does not constitute financial advice or advice of any kind. Coin Edition is not responsible for any losses incurred as a result of the utilization of content, products, or services mentioned. Readers are advised to exercise caution before taking any action related to the company.


