
- Ethereum’s rising structure and reclaimed levels signal firm short-term bullish momentum.
- Surging open interest above $40B shows stronger trader conviction and higher leverage risks.
- Persistent exchange outflows indicate tightening liquid supply that may support price strength.
Ethereum is building steady upward momentum as market conditions shift in its favor, with price strength, derivatives activity, and exchange flows now pointing to a more constructive trend. The asset continues to recover from November’s lows, while traders increase exposure through futures markets.
Moreover, exchange balances show a gradual supply reduction that may influence price behavior in the coming weeks. This combination offers a clearer view of how Ethereum’s market structure is evolving as 2025 nears its close.
Price Structure Shows Steady Improvement
Ethereum reclaimed short-term moving averages and broke above the $3,247 level, which acted as a key barrier during the recent downturn. Moreover, the 4-hour trend shows a sequence of higher lows that reinforces short-term strength. The price trades near $3,318 and remains close to the upper Bollinger Band, showing continued momentum.
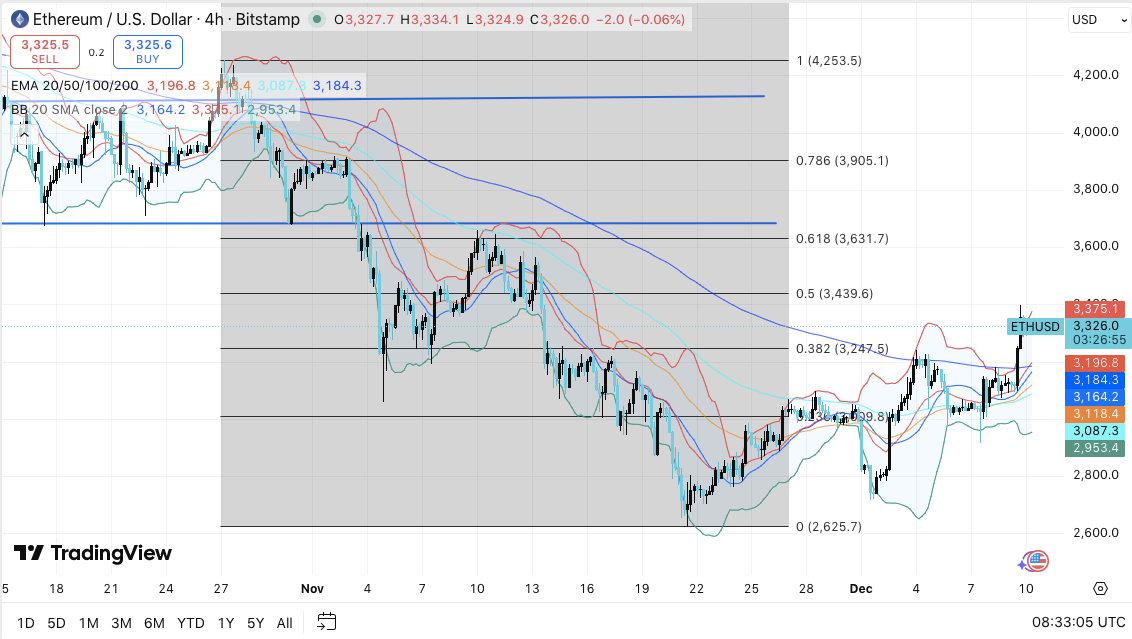
Besides, the next major objectives appear at $3,375 and $3,439, where traders expect heavier resistance. A move through these areas may open a path toward the $3,631 region, which marks a critical retracement point.
Related: Bitcoin Price Prediction: Buyers Hold Channel Support as Fed Decision Drives…
Support now sits at $3,247 and within the EMA cluster around $3,164 to $3,196. These zones determine whether buyers keep control during volatility.
Derivatives Activity Gains Speed
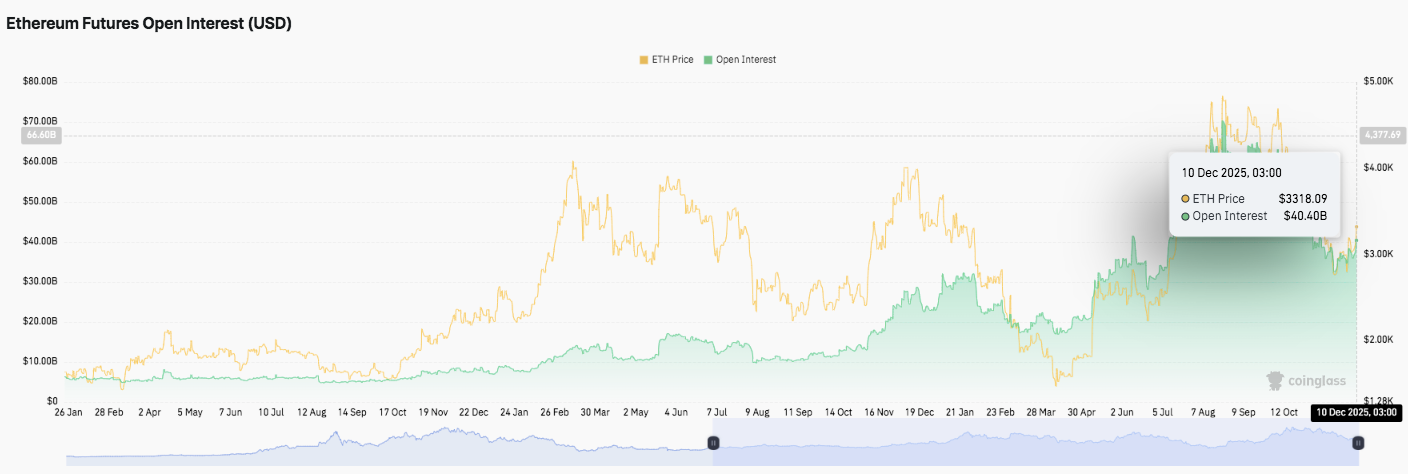
Ethereum futures open interest shows a strong rise through 2025 as traders increase participation. Consequently, open interest climbed above $40 billion by December 10, showing higher conviction across leveraged markets.
The increase developed alongside price gains, which signals directional interest rather than forced repositioning. Moreover, the higher futures exposure suggests stronger speculative activity as traders prepare for potential upside attempts. However, the elevated leverage may also raise liquidation risks during sharp market moves.
Exchange Flows Point to Reduced Liquid Supply
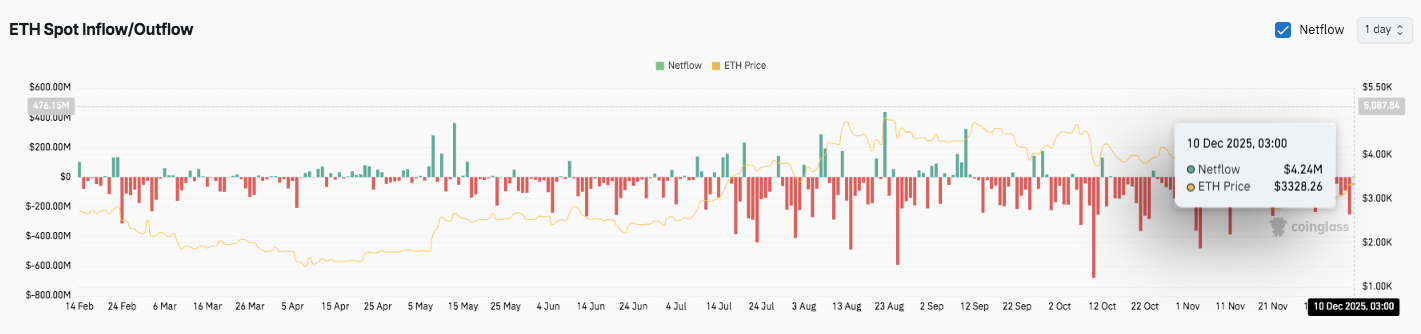
Exchange data shows persistent outflows for most of the year, which indicates a shift toward long-term holding behavior. Outflows grew heavier between late October and November during large market drawdowns.
Related: Avalanche Price Prediction: AVAX Attempts a Turnaround as Buyers Test…
Additionally, deposits briefly picked up on December 10 with a small positive netflow. This shift did not alter the broader trend of declining exchange supply. Hence, reduced available liquidity may support price stability if demand continues to build.
Technical Outlook for Ethereum Price
Key levels remain well-defined as Ethereum enters a pivotal trading zone.
- Upside levels: $3,375, $3,439 (0.5 Fib), and $3,631 (0.618 Fib) stand as the immediate hurdles. A confirmed breakout above these layers opens the door toward $3,905 and $4,253.
- Downside levels: Support sits at $3,247 (0.382 Fib), followed by the EMA cluster between $3,164 and $3,196. Deeper pullbacks expose $3,087 and $2,953.
- Resistance ceiling: The $3,439 zone remains the major pivot. It rejected advances during November and now serves as the critical level to flip for medium-term bullish continuation.
The technical picture shows Ethereum climbing out of a corrective structure while pressing into resistance defined by the 0.5–0.618 Fibonacci band. The market now trades inside an expanding momentum phase, yet Bollinger Band pressure shows early signs of volatility tightening. A decisive move outside this compression window could set off a stronger directional wave.
Will Ethereum Push Higher From Here?
Ethereum’s next move depends on whether buyers can defend $3,247 long enough to mount a clean break above $3,375 and the heavier $3,439 wall. Sustained inflows, improving open interest, and stronger EMA alignment support a bullish continuation if momentum holds.
If buyers build pressure, ETH could extend toward the $3,631 golden pocket, which remains the most important mid-term breakout level. Clearing that zone reopens the path to $3,905 and potentially $4,253.
Failure to hold $3,247, however, puts the rally at risk and exposes ETH to the deeper support band at $3,164–$3,196. A breakdown there shifts the focus to $3,087 and $2,953, where the broader structure weakens.
Related: Chainlink Price Prediction: LINK Attempts a Short-Term Recovery…
For now, ETH sits in a critical zone. The broader December narrative, rising derivatives participation, and thinning exchange supply all support upside potential. However, conviction flows and a confirmed breakout above $3,439 will determine whether Ethereum transitions into a larger trend reversal or pauses for further consolidation.
Disclaimer: The information presented in this article is for informational and educational purposes only. The article does not constitute financial advice or advice of any kind. Coin Edition is not responsible for any losses incurred as a result of the utilization of content, products, or services mentioned. Readers are advised to exercise caution before taking any action related to the company.


