
- Ethereum stalls near $2,914 as a fresh $78.6M ETF inflow fails to offset heavy $129.2M spot outflows.
- ETH remains trapped under a steep downtrend with all major EMAs stacked bearish above $3,115.
- A tightening intraday triangle signals a decisive move ahead as $2,900 support and $3,000 resistance converge.
Ethereum price today trades near $2,914, holding just above short term support after another failed attempt to break the downtrend that has capped every rally since early September. The rejection keeps pressure on buyers as spot flows remain negative and the EMA cluster continues to act as a ceiling.
ETF Buying Offers Support But Fails To Shift Momentum
$ETH ETF inflow of $78,600,000 🟢 yesterday.
— Ted (@TedPillows) November 26, 2025
BlackRock bought $46,100,000 in Ethereum. pic.twitter.com/Ww7wsXt7Y3
Fresh ETF data showed a rare positive inflow yesterday. Funds added $78.6 million in net Ethereum exposure, led by a $46.1 million purchase from BlackRock. The inflow provides some relief after two weeks of red prints across most issuers. It also shows that institutional desks are selectively adding exposure at lower prices.
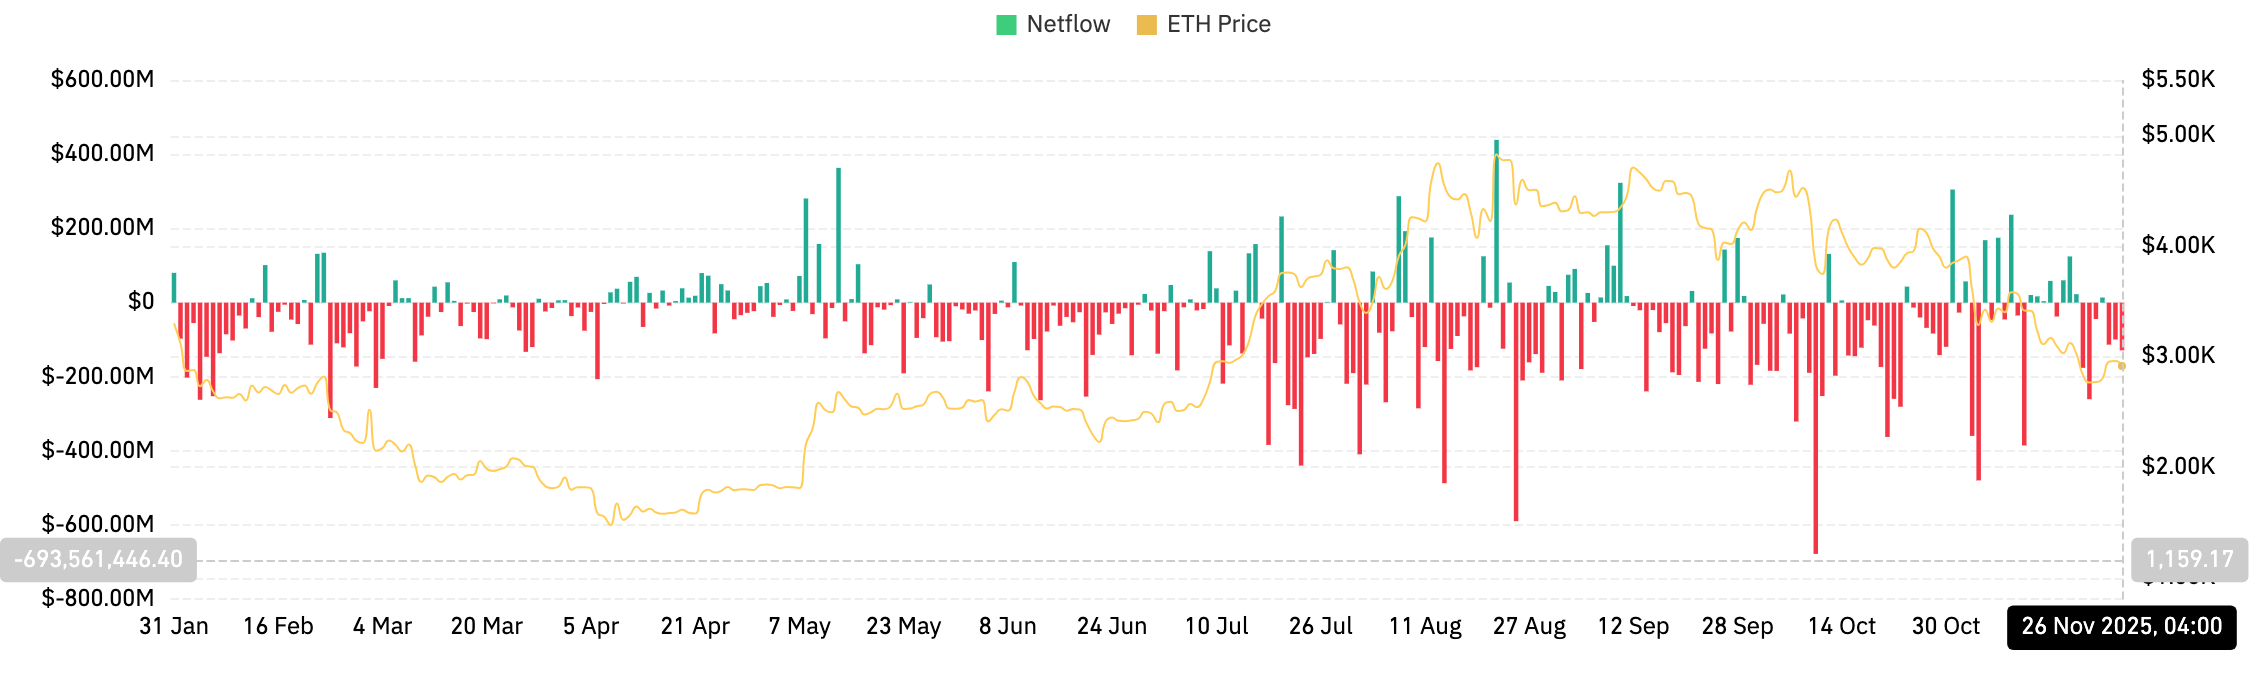
However, spot flows tell a different story. Coinglass recorded $129.2 million in outflows on November 26. This continues a multi session pattern of negative netflows that has persisted across most of November. When ETF inflows collide with sustained spot selling, price often stalls rather than forms a trend. That tension explains why Ethereum has not been able to break the descending trendline even with institutional bids improving.
Downtrend Remains Intact As EMAs Align Bearish
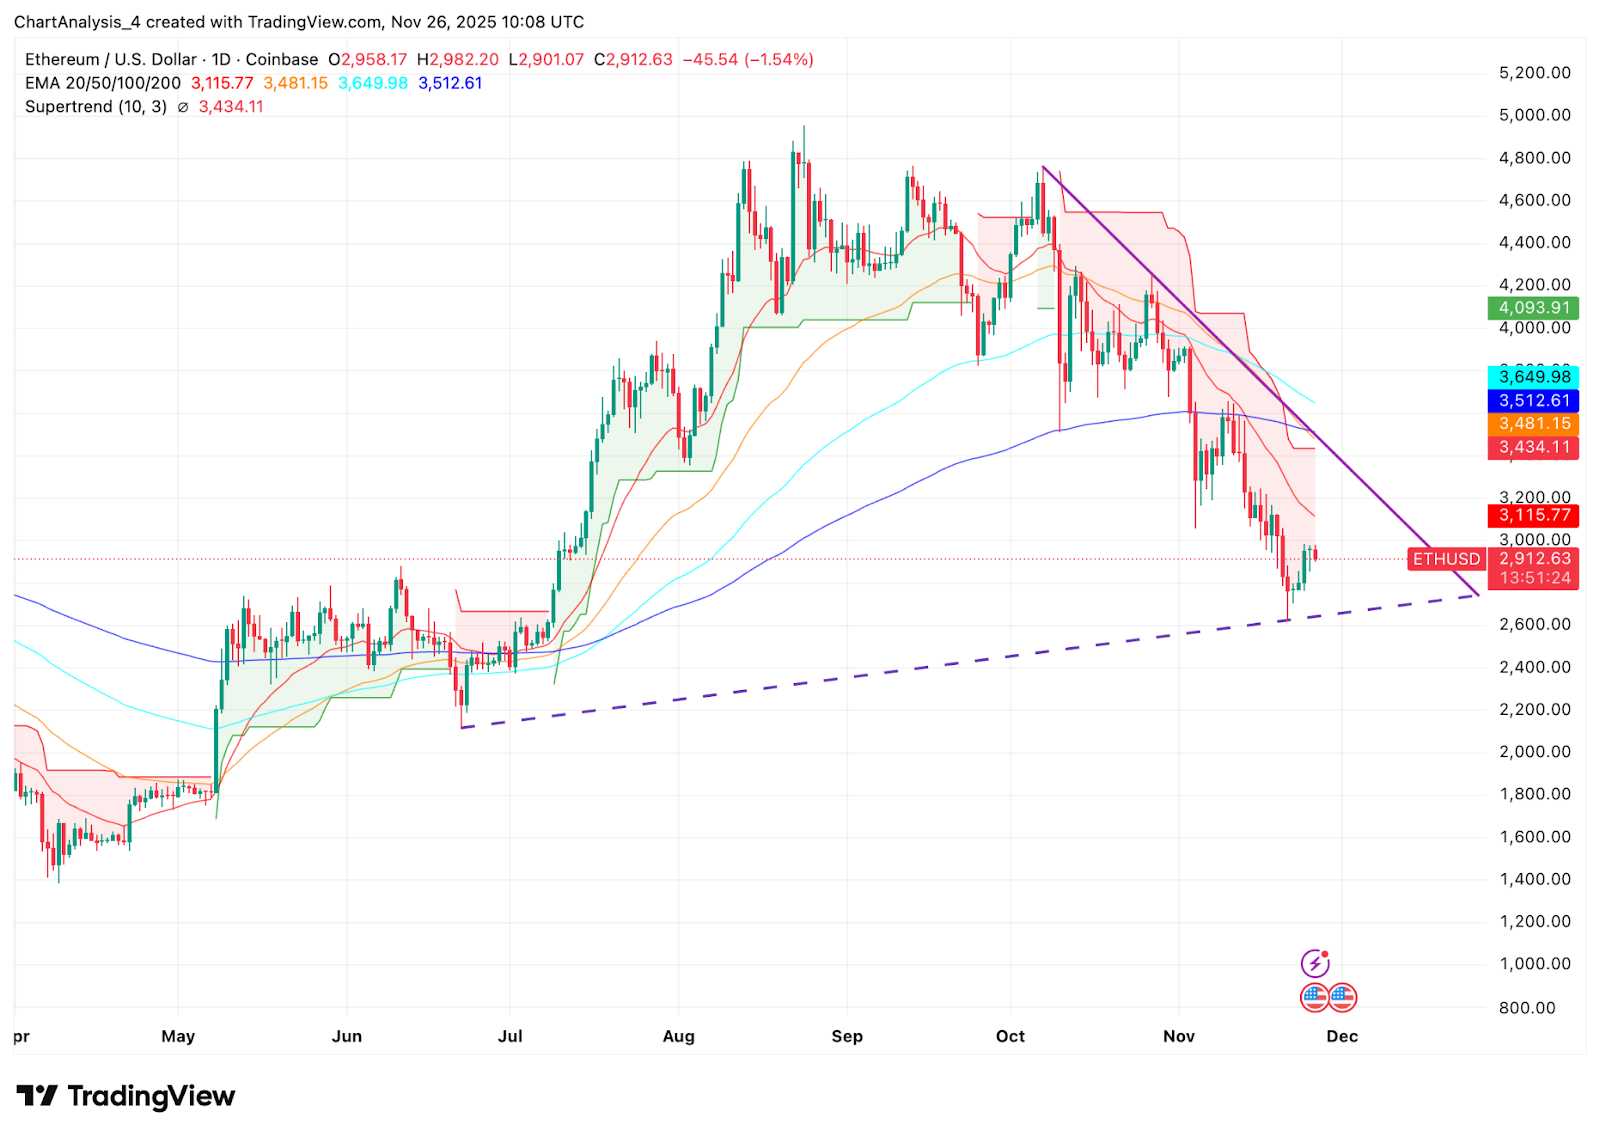
The daily chart shows Ethereum trading firmly below its 20 day EMA at $3,115, the 50 day EMA at $3,481, the 100 day EMA at $3,649, and the 200 day EMA near $3,512. This alignment keeps the trend biased lower. Each rebound over the past three weeks has faded as price touched the underside of the 20 day EMA.
The descending trendline from the September top reinforces this barrier. The latest test near $3,000 failed cleanly, pushing ETH back toward the mid range. Sellers continue to defend this line, and until ETH prints a full daily close above it, the market remains in a corrective structure.
The Supertrend on the daily timeframe sits at $3,434, well above current price. This indicator has held firmly red since the breakdown earlier this month. A close above this band is needed to confirm a shift in directional control.
Related: Pi Price Prediction: Pi Nears Breakout Amid Scams, Speculation, and Utility
The long term rising trendline from April sits near $2,750. This area has acted as a multi month base and represents the next major demand zone if downside pressure continues. A retest of this level remains possible if ETH fails to hold the $2,900 region.
Intraday Structure Compresses Into A Symmetrical Triangle
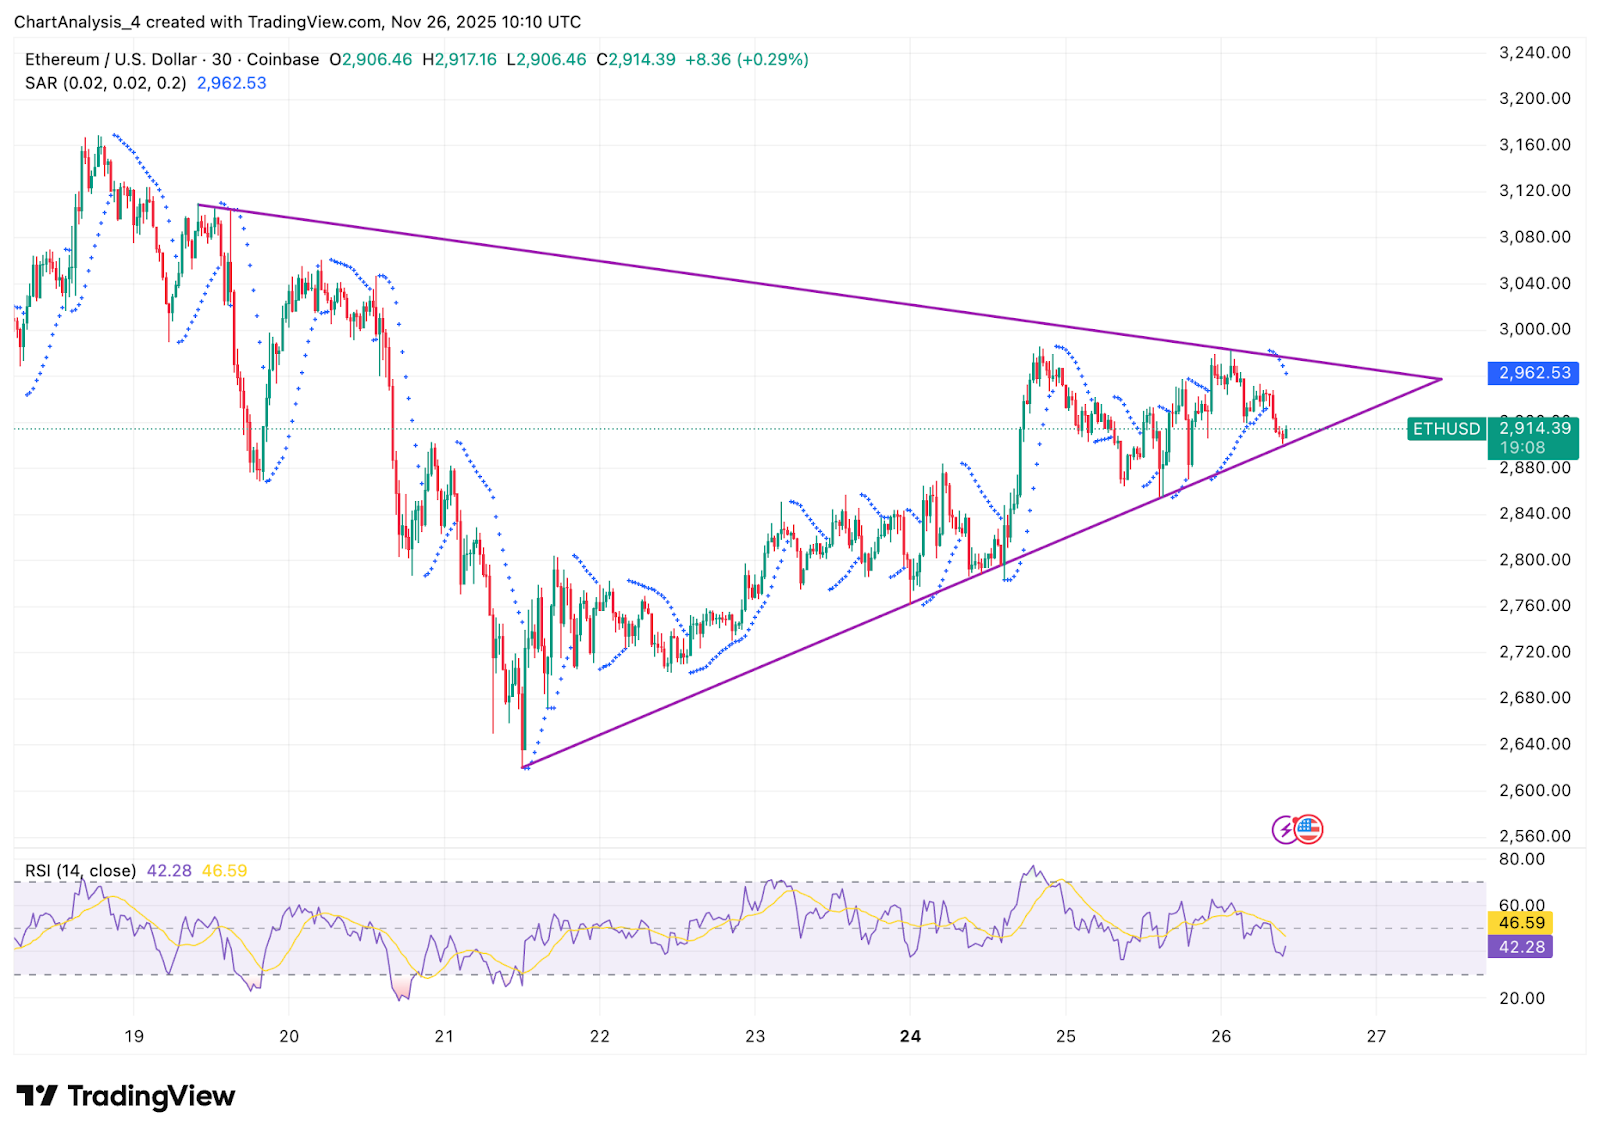
The 30 minute chart shows ETH trading inside a tightening triangle as intraday traders form higher lows above $2,860 while the upper boundary holds below $2,965. This compression reflects indecision after the recent trendline rejection.
Parabolic SAR dots remain above price, showing that sellers still control short term momentum. The RSI sits near 42, signaling mild bearish bias without being oversold. This combination suggests ETH is waiting for a catalyst to break out of the intraday range.
A breakout above $2,965 would give buyers a chance to pressure the $3,000 zone again. A break below $2,860 exposes $2,820 and increases the probability of a deeper pullback toward the long term trendline.
For now, intraday swings remain reactive rather than directional. Traders are using the boundaries of the triangle for short term setups while waiting for broader flows to settle.
Outlook. Will Ethereum Go Up?
Ethereum faces a clear technical path.
- Bullish case: A close above $3,115 would signal the first step toward recovery. Strength above the descending trendline near $3,000 confirms a breakout, and reclaiming the 50 day EMA near $3,481 sets the stage for a move toward $3,650.
- Bearish case: Failure to hold $2,900 opens the door to $2,820 and $2,750, the long term trendline that has supported the market since April. A breakdown below $2,750 turns the move into a deeper correction toward $2,600.
Ethereum’s next major move depends on whether buyers can break the trendline and flip key EMAs. Strength above $3,115 changes the narrative. Losing $2,750 hands full control to sellers.
Related: World Liberty Financial Price Prediction: Strategic Buys and Inflows Fuel Fresh Uptrend
Disclaimer: The information presented in this article is for informational and educational purposes only. The article does not constitute financial advice or advice of any kind. Coin Edition is not responsible for any losses incurred as a result of the utilization of content, products, or services mentioned. Readers are advised to exercise caution before taking any action related to the company.
 Price Prediction: Canton Eyes Key Break After Market Activity Spike")


