
- A whale holding $218M in ETH adds aggressively to long exposure, boosting sentiment ahead of a breakout attempt.
- ETH ETFs record $35.5M in inflows, with BlackRock buying $23.7M, signalling renewed institutional demand.
- Price sits inside a tightening triangle; clearing $3,200 opens targets at $3,380–$3,510, while $3,000 remains key support.
Ethereum price today trades near $3,105, holding inside a tightening triangle that has guided price action since July. The market is sitting right at the apex, and the next move will be decisive. Sellers remain active along the descending trendline, while buyers continue to defend the long-term base near $3,000.
Whale Activity And ETF Flows Shift Sentiment
A major whale who shorted before the October 10 crash has added aggressively to his long, now holding $218.18 million in ETH. His liquidation sits at $2,117, giving him wide room to hold into volatility. Current unrealized profits are $3.37 million, signalling conviction rather than a short-term scalp. This behaviour is lifting sentiment because this same profile correctly positioned ahead of the previous major move.
ETF demand has also flipped the narrative. Fresh data shows a $35.5 million inflow into ETH ETFs on December 8. BlackRock alone bought $23.7 million worth of Ethereum. This is the strongest daily inflow in more than a week and offers support against concerns about why Ethereum price was going down earlier in the month.
Related: XRP Price Prediction: Market Compression Signals a Potential Break Ahead
Trendline Pressure Intensifies As Price Compresses
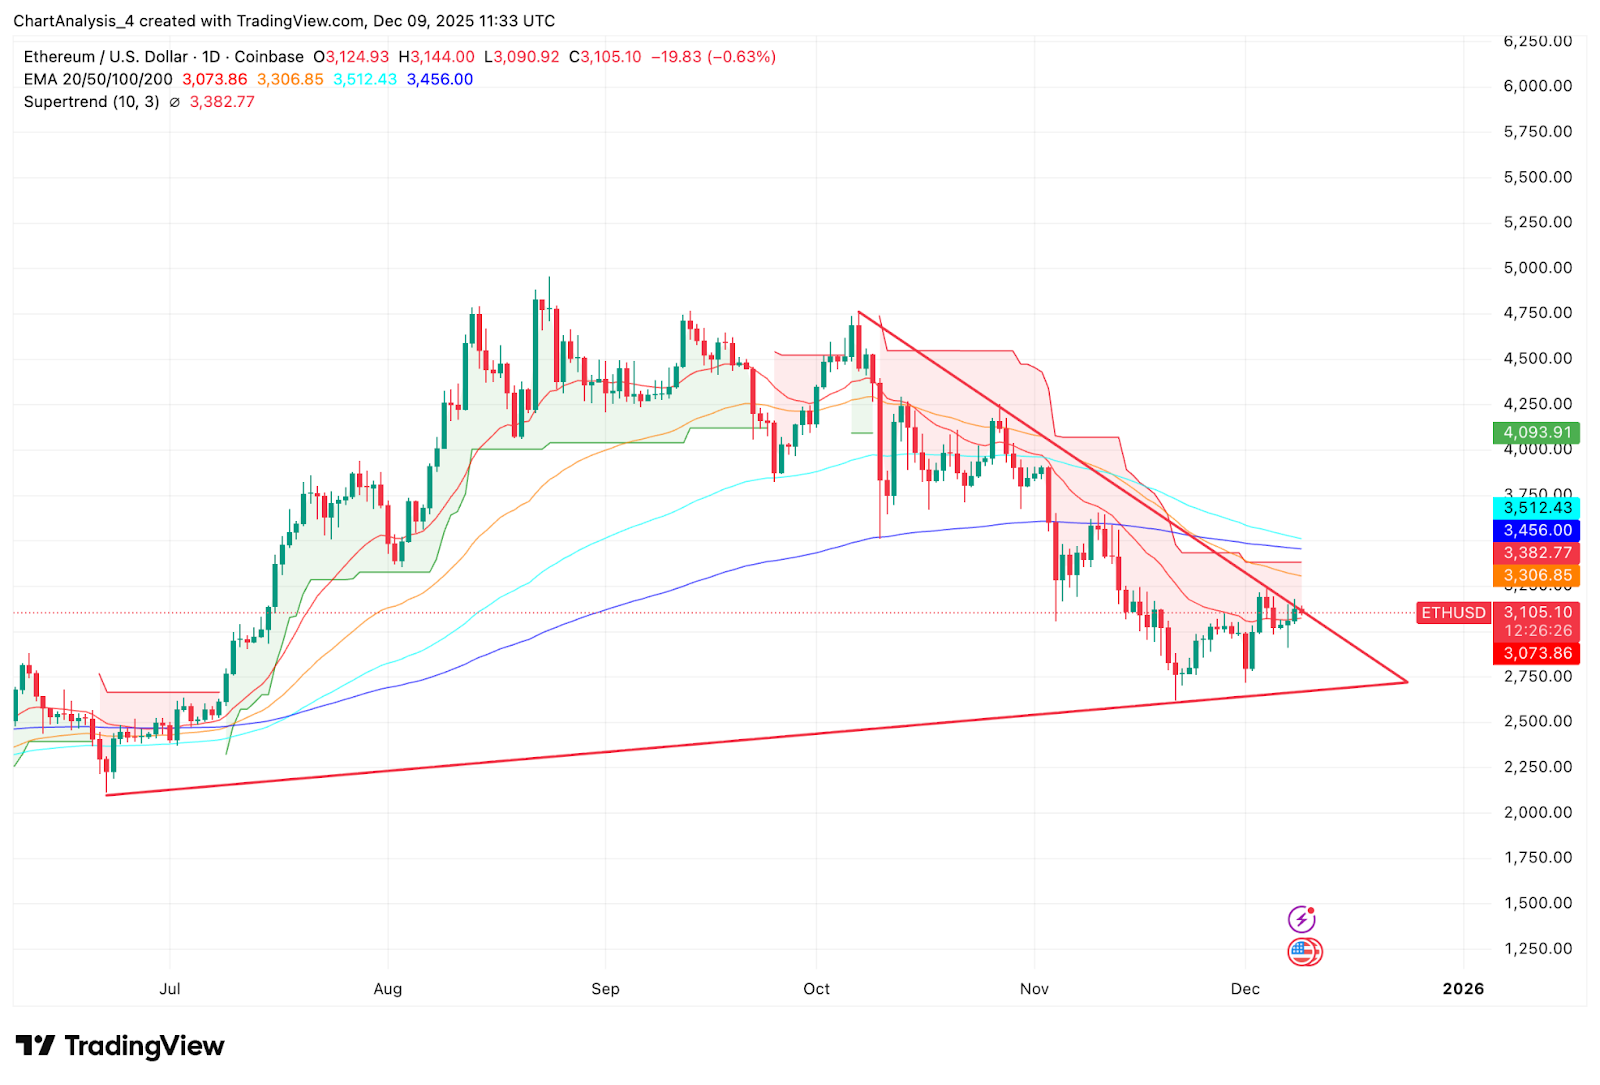
Ethereum price continues to track a very clean descending trendline from the September high. Every rally into this line has failed, and today’s rejection zone sits around $3,170–$3,200. Breaking this band is the most important bullish trigger in the near term.
Below, support at $3,000–$3,030 remains the line the market refuses to lose. Wick tests into this area have been bought quickly, though follow-through has been weak. This shows buyers protecting structure but lacking momentum.
The triangle apex is now only days away, and a decisive move is expected. If the market clears $3,200, momentum can shift toward $3,380 and then $3,510, where the 100 EMA aligns. If the breakdown occurs, the next levels sit at $2,950 and $2,820.
Short-Term Ethereum Price Action Shows Mixed Signals
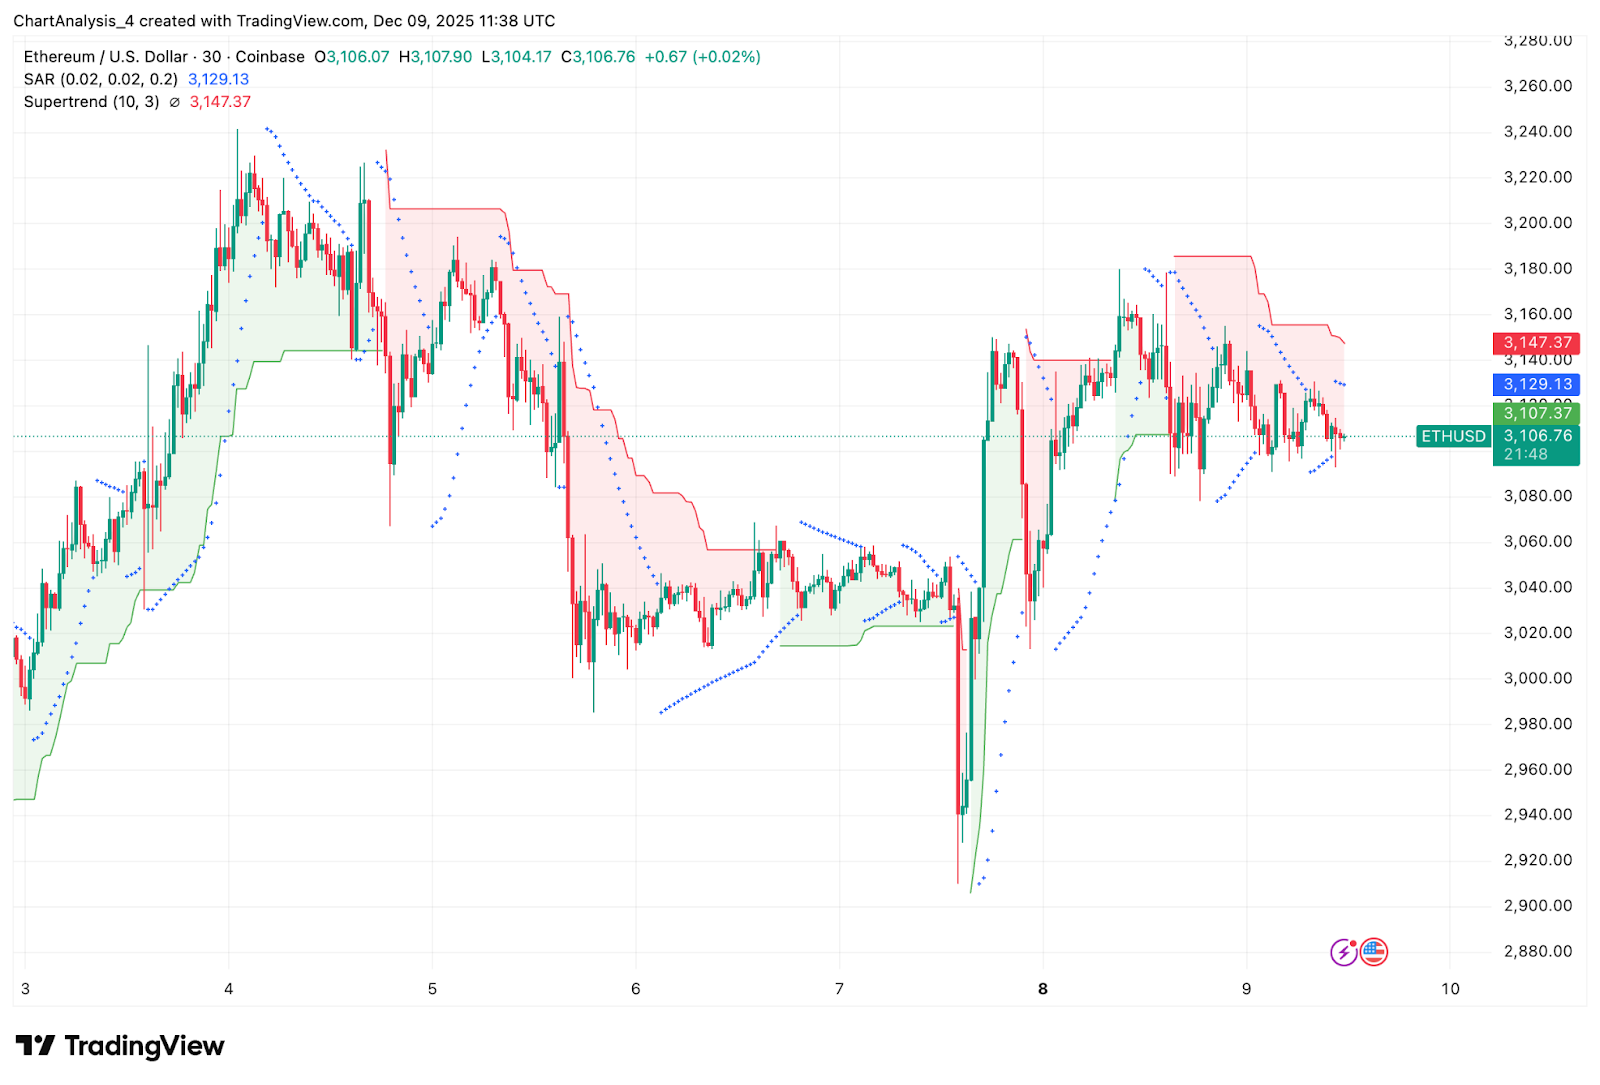
The 30-minute chart shows Ethereum price struggling beneath the Supertrend resistance at $3,147, with repeated failures to build upward momentum. Parabolic SAR flipped bearish again, marking a loss of short-term control for buyers. This aligns with the broader theme of hesitation ahead of the breakout.
Related: Bitcoin Price Prediction: Institutions Boost Exposure While Market Awaits Breakout
Despite this, the structure has not broken. Higher lows continue to hold on intraday charts, hinting that dip-buyers remain active. The mixed signals underline the compression traders are now dealing with.
For now, volatility is muted. But this type of muted behaviour typically precedes large Ethereum price moves into major events.
Technical Forecast Table
| Indicator | Signal | Level |
| Trendline | Bearish | Rejection at $3,170–$3,200 |
| Key Support | Neutral | $3,000–$3,030 |
| Breakout Target | Bullish | $3,380 |
| Breakdown Target | Bearish | $2,820 |
| Momentum (SAR) | Bearish | $3,147 resistance |
| ETF Flows | Bullish | +$35.5M |
| Whale Position | Bullish | $218.18M long exposure |
Disclaimer: The information presented in this article is for informational and educational purposes only. The article does not constitute financial advice or advice of any kind. Coin Edition is not responsible for any losses incurred as a result of the utilization of content, products, or services mentioned. Readers are advised to exercise caution before taking any action related to the company.


