
- Ethereum rebounds 3.03% to $2,899.51 after defending the ascending trendline drawn from April 2025 lows near $1,500.
- Daily network transactions reach 2.34 million on a 7-day moving average, signaling unprecedented adoption.
- Spot exchange outflows of $66.93 million suggest aggressive accumulation as price tests long-term support.
Ethereum price today trades near $2,899.51 after bouncing from a multi-month ascending trendline that has supported the recovery since April. The rebound comes as network activity reaches unprecedented levels, with daily transactions hitting an all-time high that contradicts the bearish price action.
Spot Outflows Signal Aggressive Accumulation
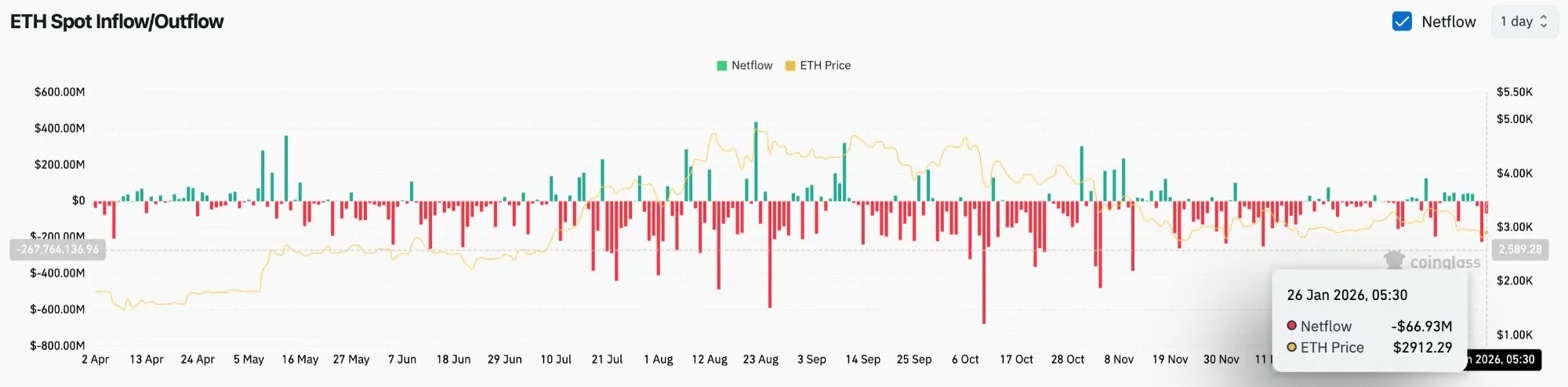
Exchange flow data confirms the bullish fundamental picture. Coinglass recorded $66.93 million in net outflows on January 26, meaning coins are moving off exchanges into private wallets at an aggressive pace.
The outflow is one of the largest single-day accumulation events in recent weeks. When spot flows turn sharply negative during price weakness, it typically indicates that conviction buyers view the dip as opportunity rather than warning.
Long-Term Trendline Holds Support
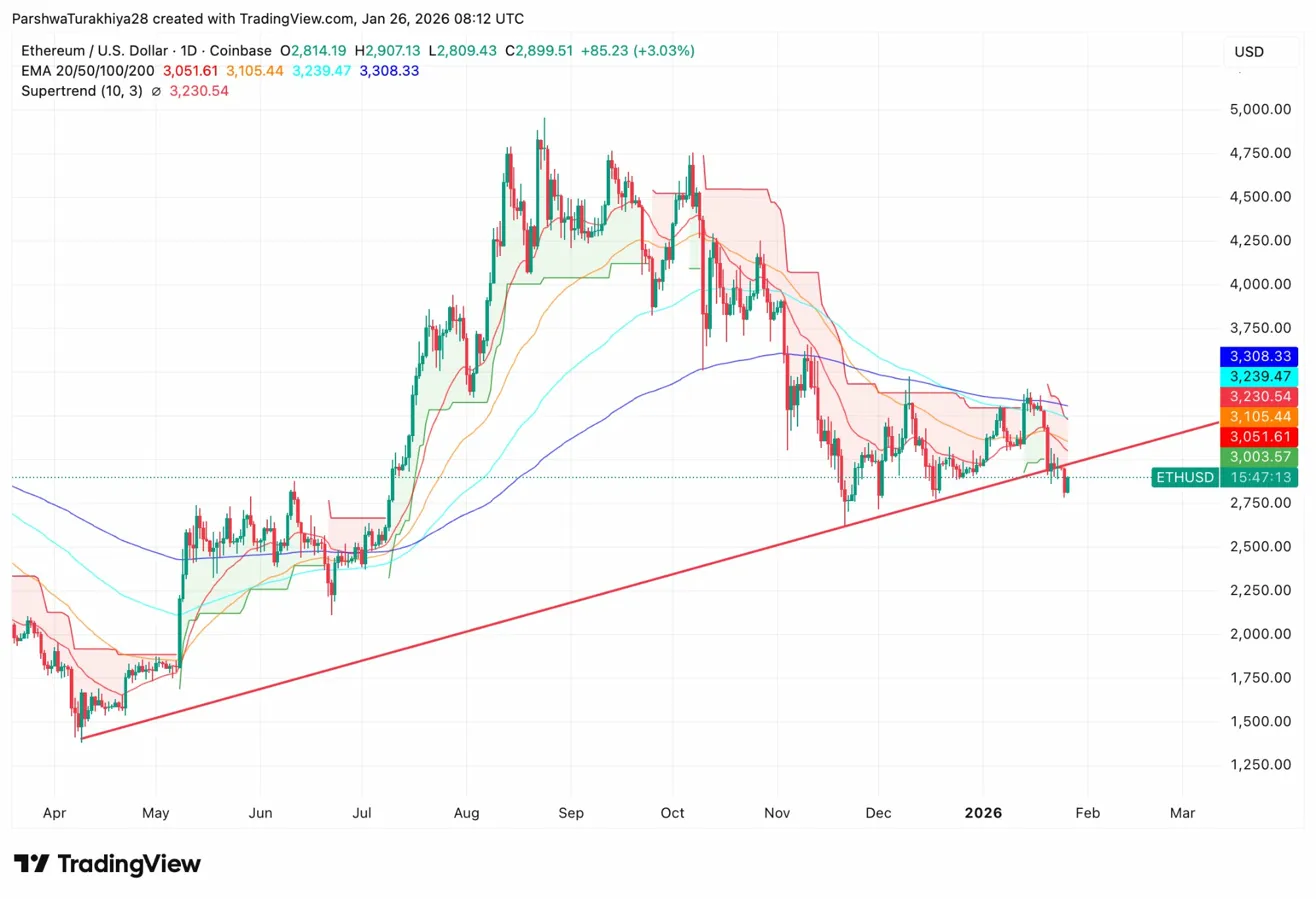
On the daily chart, Ethereum bounced from the ascending trendline drawn from the April 2025 low near $1,500. This structure has supported the entire recovery, with multiple tests attracting buyers who defend the pattern.
Price remains below all four EMAs, reflecting short-term weakness:
- Immediate resistance: $3,051 (20 EMA)
- Secondary resistance: $3,105 (50 EMA)
- Major resistance: $3,239 (100 EMA)
- Supertrend resistance: $3,230
- Trend resistance: $3,308 (200 EMA)
- Trendline support: $2,800 to $2,850
- Breakdown target: $2,600
The trendline has held for nine months. Breaking this structure would invalidate the recovery thesis and signal a deeper correction. Holding it maintains the bullish long-term structure despite short-term EMA pressure.
Intraday Momentum Turns Bullish
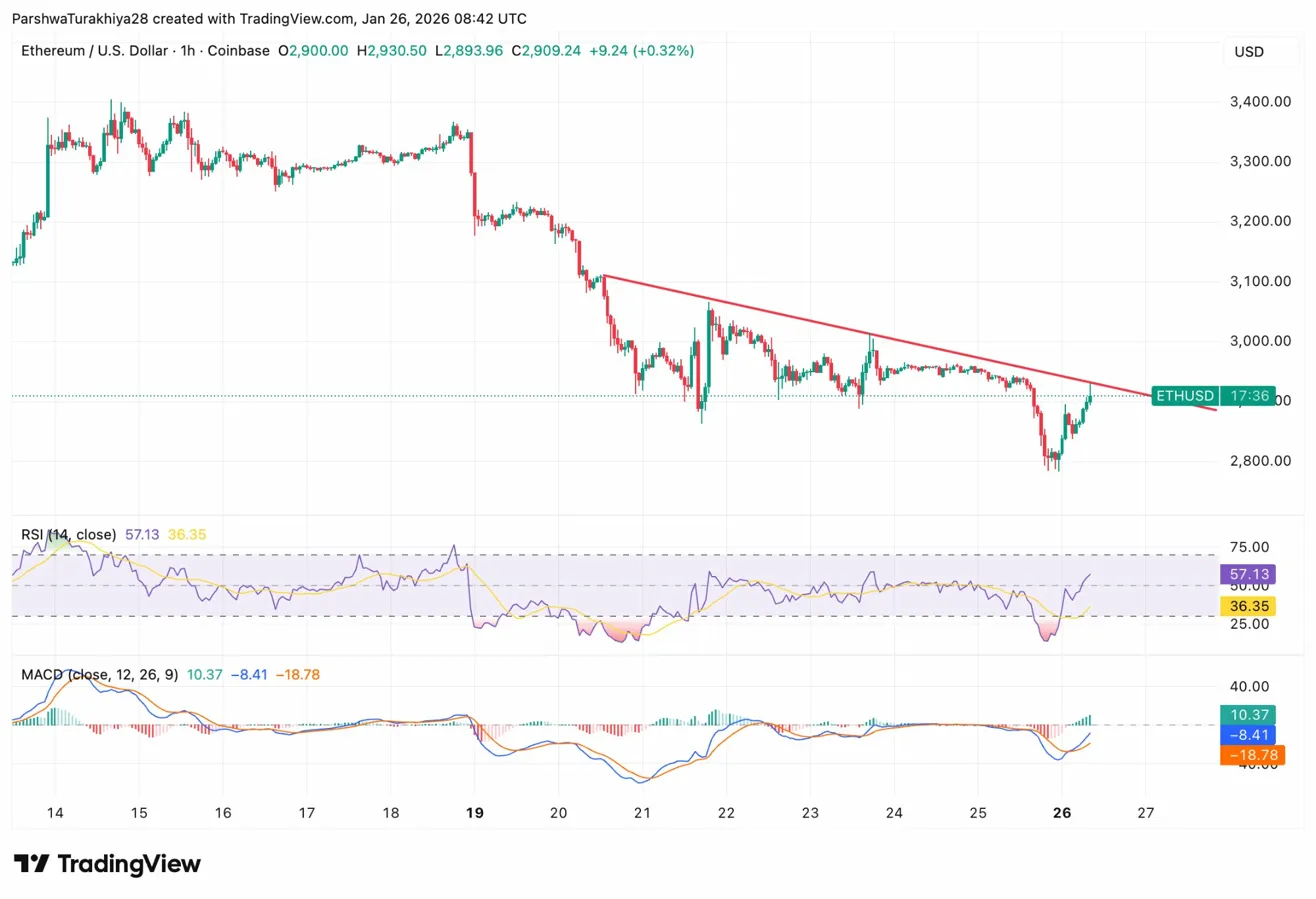
Shorter timeframes show improving conditions. On the hourly chart, ETH has bounced from $2,800 lows and broken above a descending trendline that capped rallies since January 19.
RSI climbed to 57.13, crossing above neutral and signaling improving momentum. MACD shows a bullish crossover with the histogram turning positive, confirming that near-term direction favors buyers.
The next resistance sits at $2,950 where the prior descending trendline may act as support-turned-resistance. A break above this level targets $3,000 psychological resistance and eventually the 20 EMA at $3,051.
Network Transactions Reach Historic High
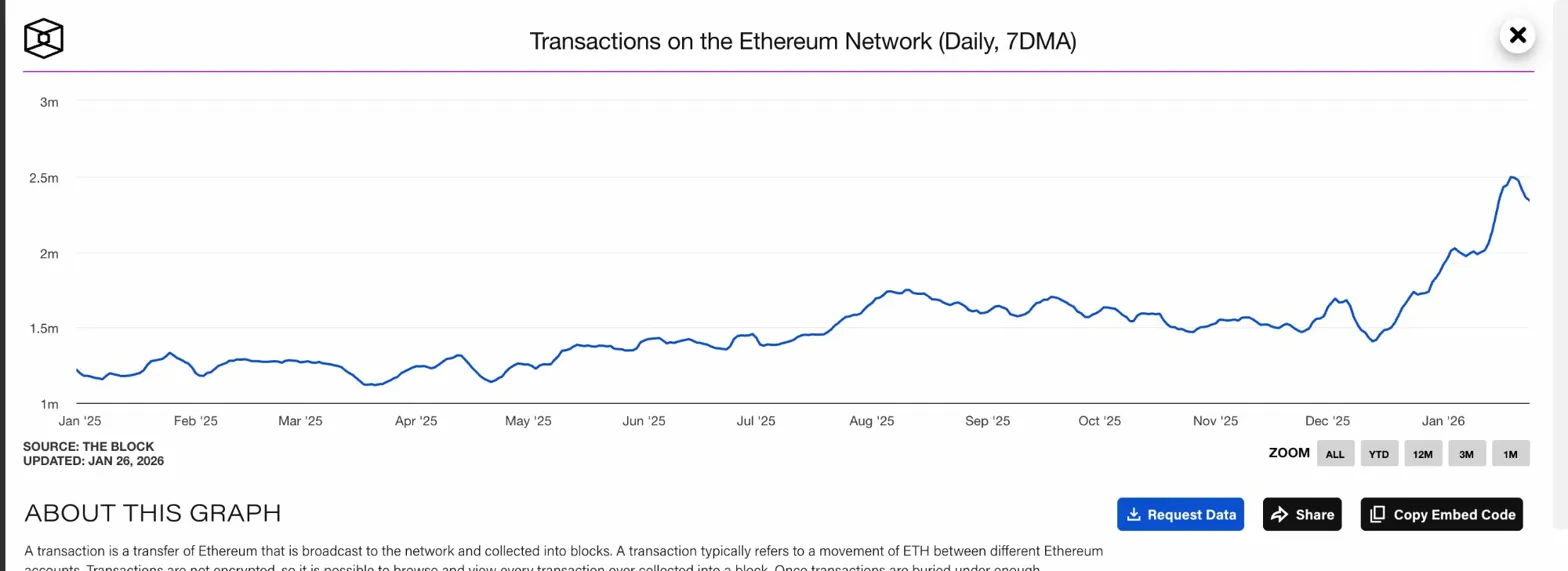
On-chain data reveals a fundamental disconnect from price. According to The Block, Ethereum’s 7-day moving average of daily transactions reached 2.34 million on January 24, which is one of the highest level in the network’s history.
The transaction count has climbed steadily throughout 2025, rising from around 1.2 million in January 2025 to current record levels. The acceleration began in December and continued into January despite the price correction.
Record transaction volume signals that network utility is expanding regardless of token price. Users are actively engaging with Ethereum applications, smart contracts, and transfers at rates never seen before. This fundamental strength creates a floor beneath price that pure speculation cannot replicate.
Outlook: Will Fundamentals Drive Recovery?
The setup shows historic network usage and aggressive accumulation meeting depressed prices. Such divergences typically resolve in favor of fundamentals, but timing remains uncertain. Bulls need a close above $3,000 to confirm the trendline bounce.
- Bullish case: Price breaks above $2,950 and reclaims $3,000. Record transaction volume and spot accumulation drive a recovery toward the 20 EMA at $3,051 and eventually $3,200.
- Bearish case: The bounce fails to hold and price retests $2,800 trendline support. A daily close below $2,800 breaks the nine-month structure and targets $2,600.
Disclaimer: The information presented in this article is for informational and educational purposes only. The article does not constitute financial advice or advice of any kind. Coin Edition is not responsible for any losses incurred as a result of the utilization of content, products, or services mentioned. Readers are advised to exercise caution before taking any action related to the company.


 Price Prediction: Canton Eyes Key Break After Market Activity Spike")

