
- Ethereum trades near $3,392, sitting on the critical $3,320–$3,210 demand zone as sellers reject every bounce from trendline resistance.
- Spot and derivatives data show risk reduction, with repeated outflows and declining open interest signaling weak conviction from buyers.
- A close below $3,210 exposes $3,000, while reclaiming the 200-day EMA at $3,594 is needed to flip momentum back toward $3,900.
Ethereum price today trades near $3,392, holding just above a critical demand zone between $3,320 and $3,210 that has acted as the last defense for buyers since August. Price failed to reclaim the daily trendline that guided the prior advance, keeping pressure on buyers while derivatives positioning shows risk reduction rather than accumulation.
Sellers Hold Control As Spot Distribution Stays Elevated
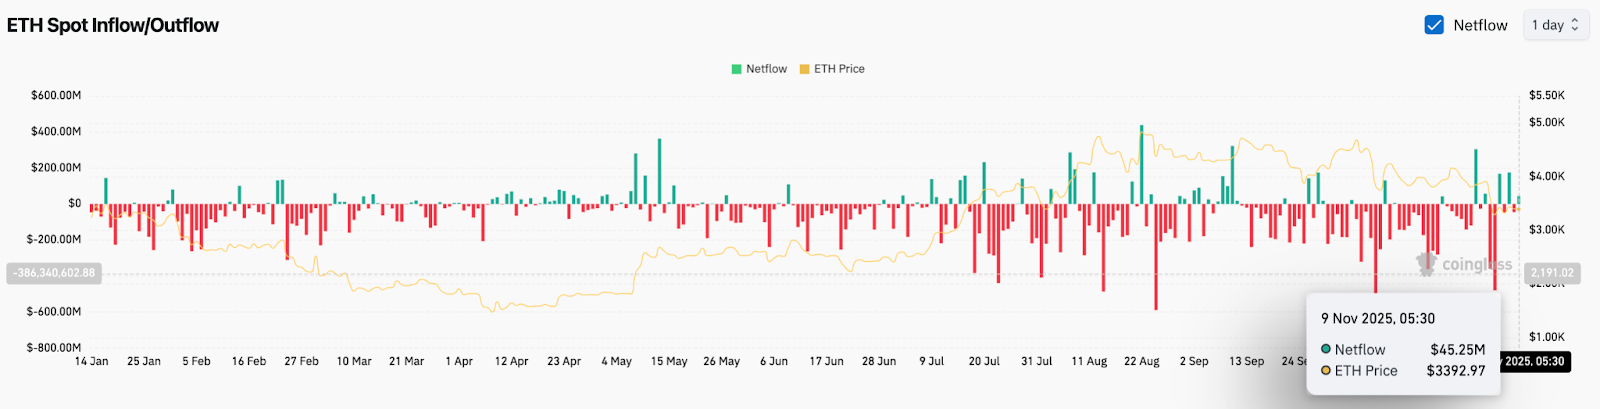
According to CoinGlass, Ethereum recorded repeated net outflows in recent sessions, including heavy distribution through late October and early November. While the latest session shows a small $45.25 million net inflow, it follows multiple deep outflow days that pushed liquidity off exchanges and triggered the breakdown from trend support.
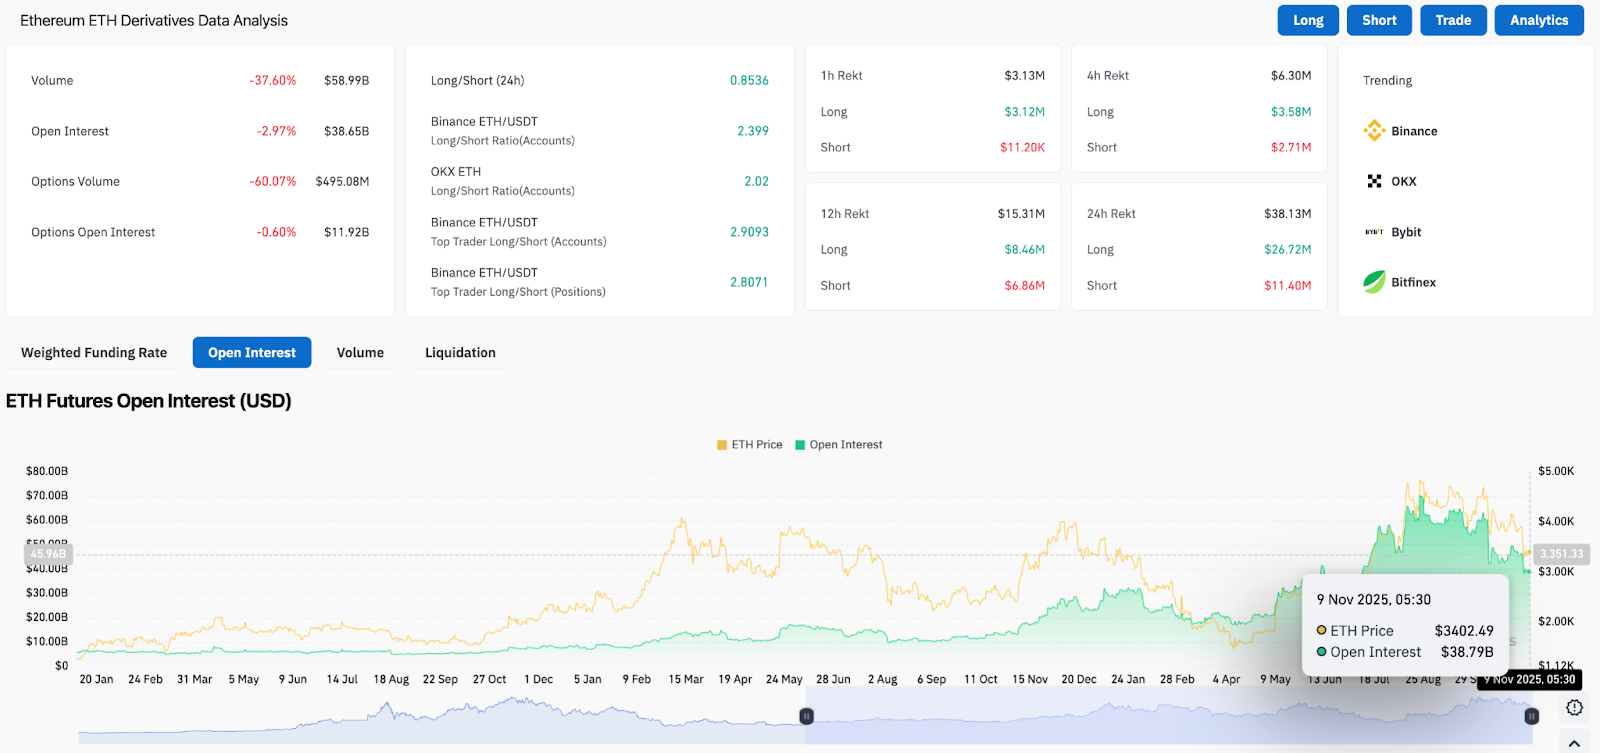
Open interest has also slipped. Derivatives data shows OI down 2.97 percent today along with a 37.60 percent drop in futures volume. Options activity shows further risk-off behavior, with options volume down 60 percent. The combination of reduced leverage and outflows indicates that market participants are stepping back until Ethereum confirms a directional break.
Trendline Rejection Forces Retest Of Key Support Zone
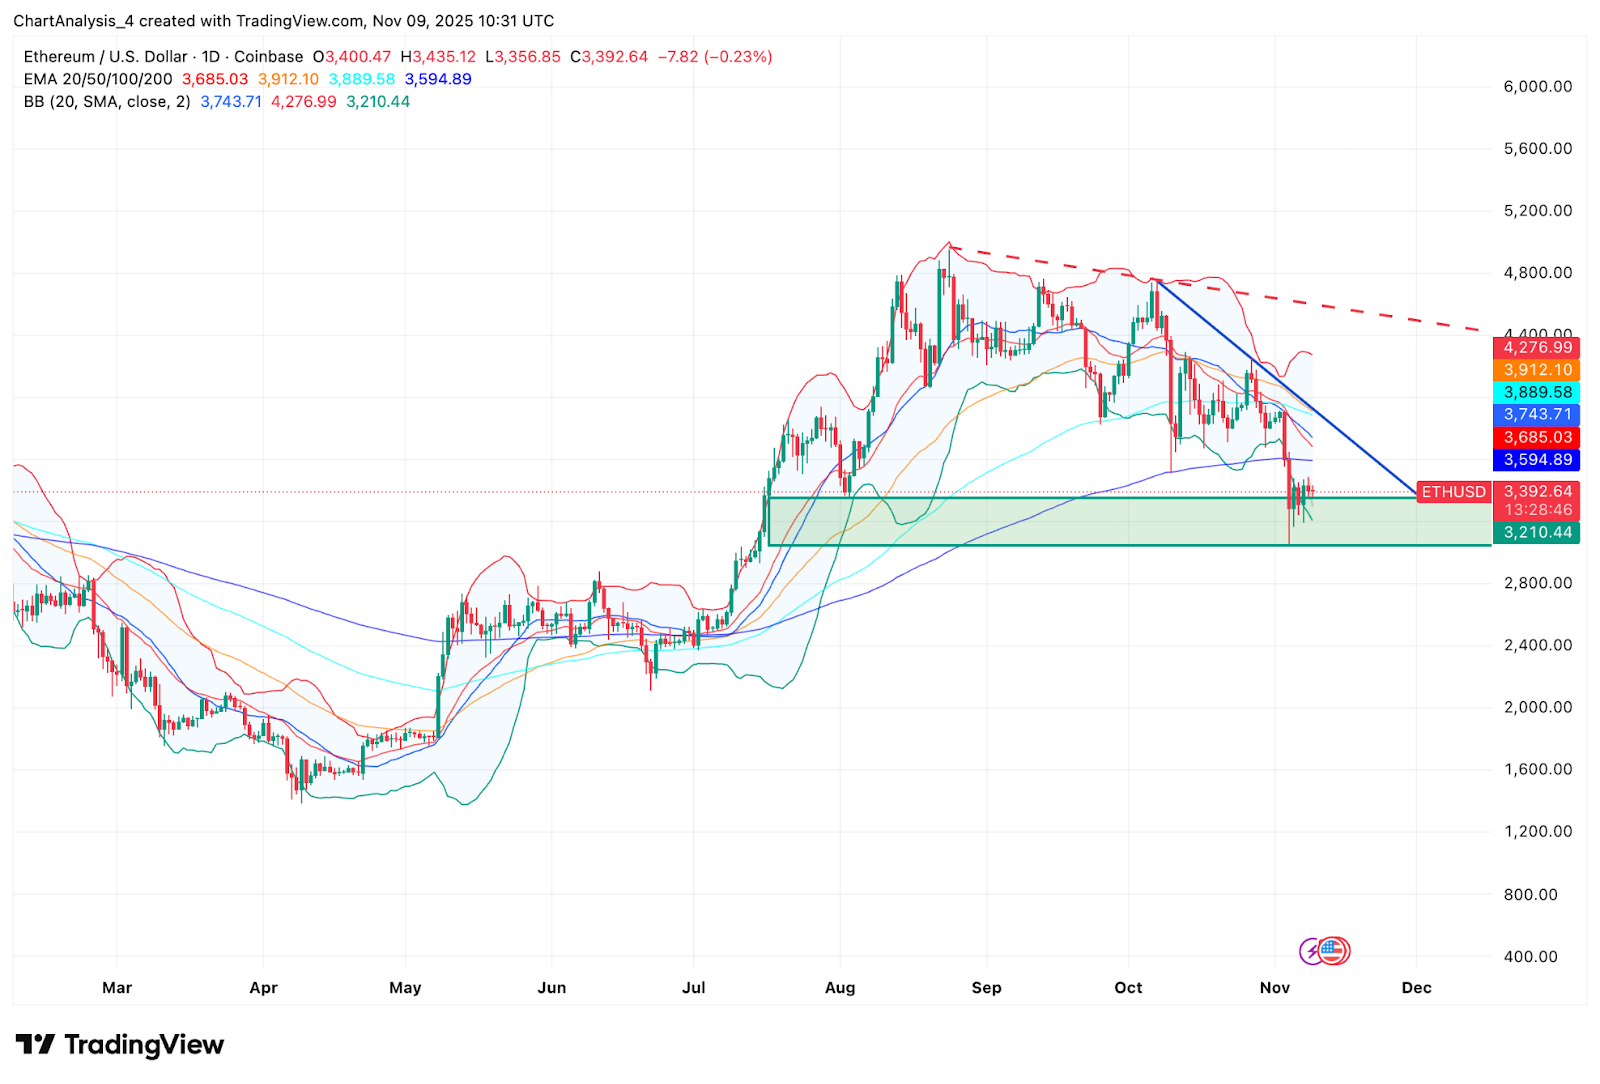
On the daily chart, Ethereum remains capped by a descending trendline from the September peak. Each attempt to reclaim the trendline has failed, and price continues to trade below a stacked group of moving averages:
- 20 day EMA: $3,685
- 50 day EMA: $3,912
- 100 day EMA: $3,889
- 200 day EMA: $3,594
All four moving averages now sit above current price, forming a strong overhead barrier. Until Ethereum reclaims at least the 200 day EMA, the broader structure remains in a short term corrective phase. Attempts to bounce are still treated as relief moves inside a downtrend.
The zone between $3,320 and $3,210 remains the most important support. This region has absorbed sell side pressure multiple times since August, creating a base for previous reversals. Losing this zone would invalidate the prior higher low structure and expose deeper downside toward $3,000.
The daily Bollinger Bands are widening as price tests the lower band near support. Widening bands during a rejection from trendline resistance usually precede continuation moves in the direction of the breakout. If buyers fail to defend the range, volatility could expand further to the downside.
Intraday Structure Shows Lower Highs As Momentum Weakens
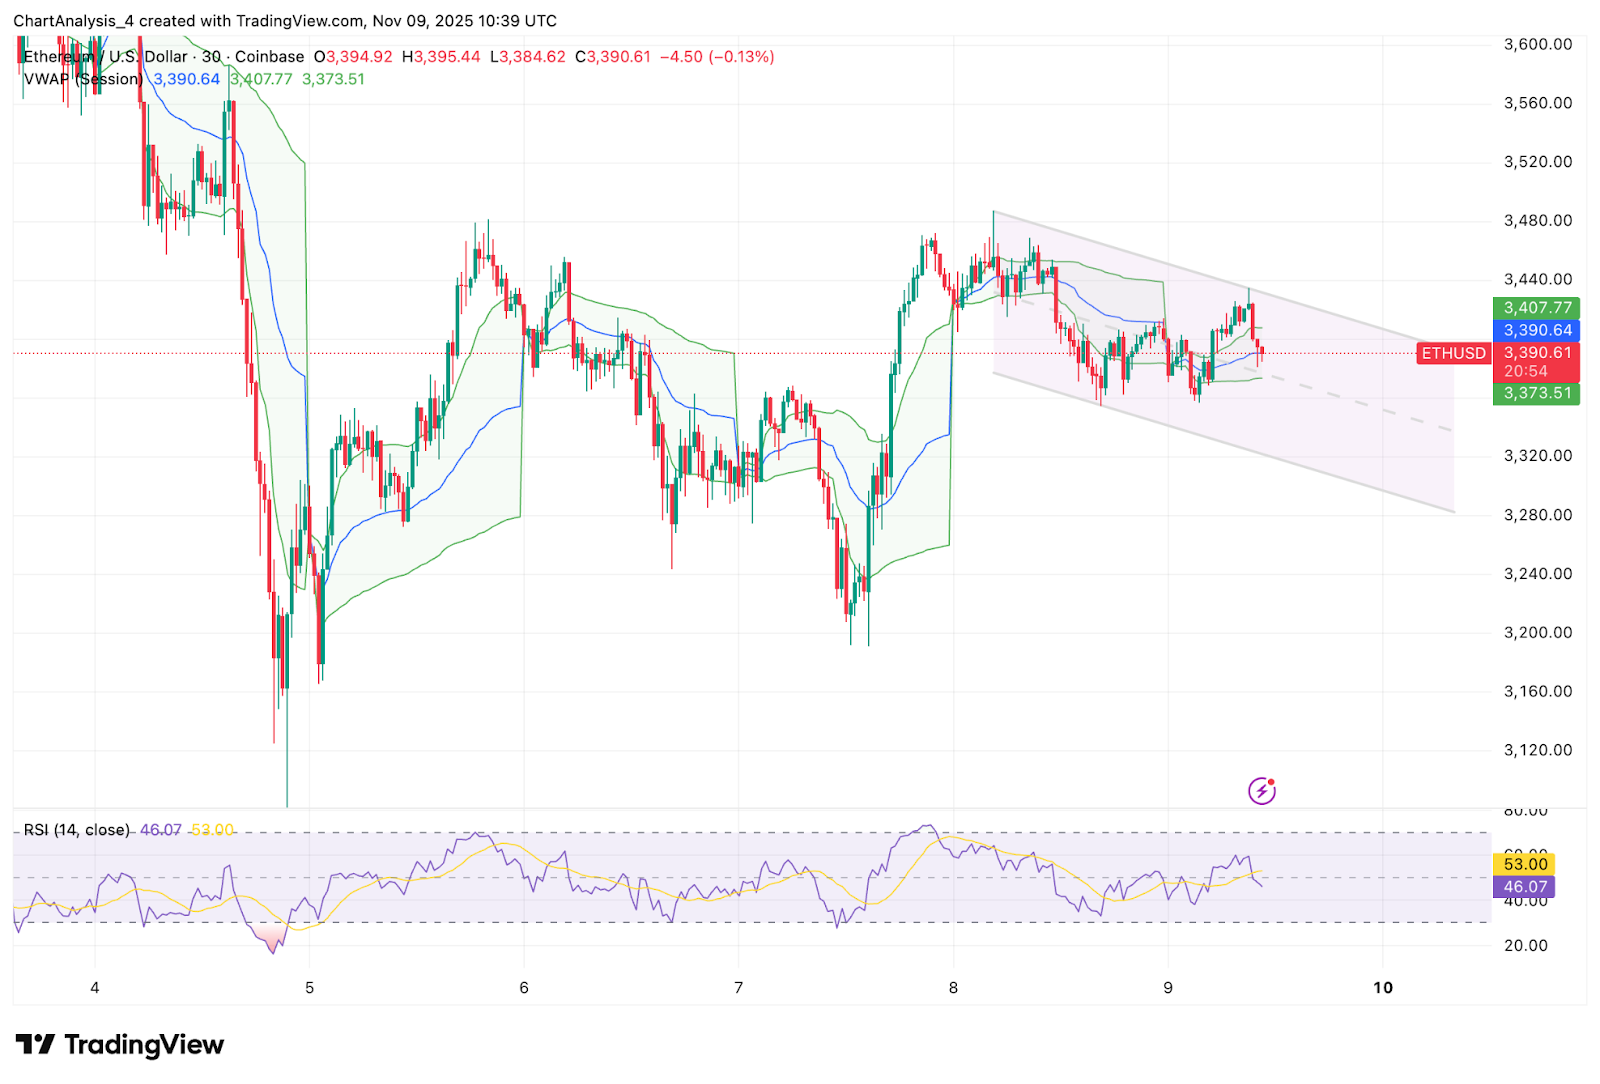
On the 30 minute chart, Ethereum continues to trade inside a descending channel. Each intraday rally has stalled at the VWAP and channel midline, confirming that sellers are still controlling shorter timeframes.
RSI on the 30 minute chart has flattened near the midline around 46, reflecting indecision. Momentum improves only when RSI breaks above 53 and sustains it, something price has not been able to hold since the breakdown.
For intraday traders, the first important level is the intraday pivot at $3,440. Rejections here keep pressure pointed toward the lower channel boundary near $3,300. Only a sustained push above $3,440 would signal that buyers are building strength.
Outlook. Will Ethereum Go Up?
Ethereum is sitting on its most important demand zone of Q4. The next move depends on how price reacts here.
- Bullish case: Ethereum rebounds from $3,320 to $3,210 and closes above $3,594, confirming a reclaim of the 200 day EMA. That would open a move toward $3,685 and eventually the wider resistance near $3,900.
- Bearish case: A daily close below $3,210 triggers a deeper correction toward $3,000, with potential extension to $2,850 if flows and volume continue to weaken.
At current levels, buyers are defending the floor but lack confirmation. A reclaim of the 200 day EMA is the trigger that shifts narrative back toward strength. Losing $3,210 turns the move into a full correction.
Disclaimer: The information presented in this article is for informational and educational purposes only. The article does not constitute financial advice or advice of any kind. Coin Edition is not responsible for any losses incurred as a result of the utilization of content, products, or services mentioned. Readers are advised to exercise caution before taking any action related to the company.


