
- Ethereum slips 0.78% to $2,926, testing the ascending channel support drawn from the December low near $2,600.
- Spot exchange inflows reach $30.04 million as buyers continue accumulating despite price trading 6% below the 20-day EMA.
- JPMorgan questions whether Fusaka upgrade gains will persist amid layer-2 competition, adding fundamental uncertainty to the technical setup.
Ethereum price today trades near $2,926.42 as the ascending channel support faces its third test this month. Spot flows remain positive despite the correction, creating a potential floor beneath price even as macro concerns and analyst skepticism weigh on sentiment.
Spot Inflows Signal Continued Accumulation
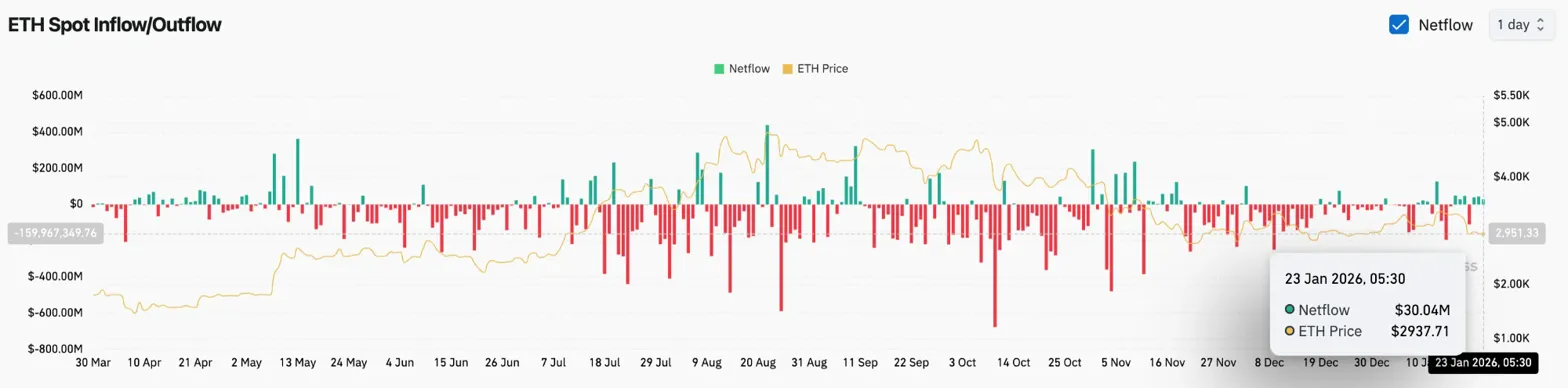
Exchange flow data shows buyers stepping in during the weakness. Coinglass recorded $30.04 million in net inflows on January 23, extending the accumulation pattern that has persisted throughout the correction.
When coins move off exchanges during selloffs, it typically reflects longer-term holders viewing current prices as attractive. This dynamic reduces available supply on order books and can accelerate recoveries once selling pressure exhausts.
The accumulation comes despite price trading 6% below the 20-day EMA, suggesting that buyers are willing to catch the falling knife rather than wait for technical confirmation.
Derivatives Show Mixed Signals
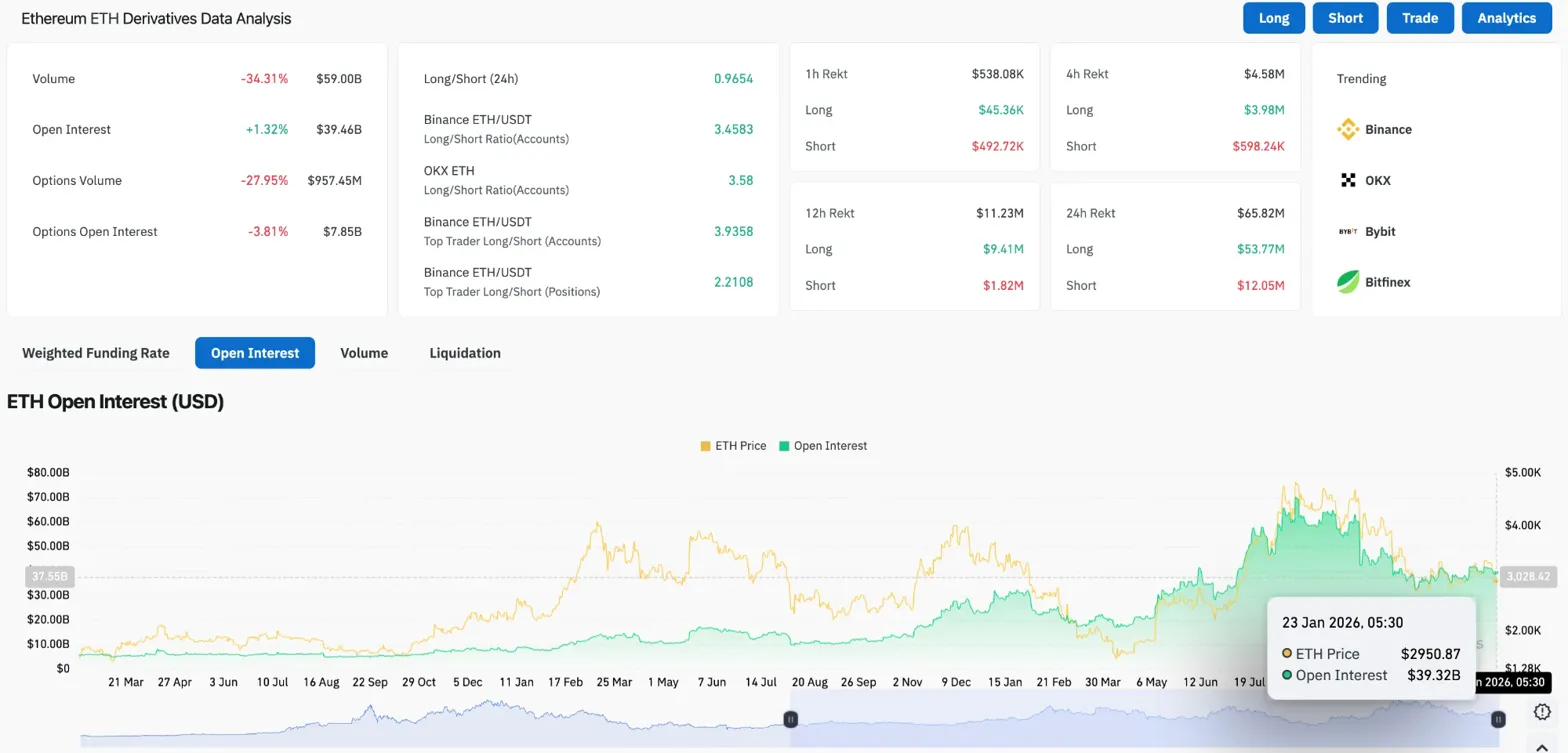
Futures markets paint a more cautious picture. Open interest rose 1.32% to $39.46 billion, but trading volume dropped 34.31% to $59 billion. The divergence suggests that existing positions are being held rather than new bets being placed.
Over the past 24 hours, $53.77 million in long positions were liquidated compared to $12.05 million in shorts. The 4:1 ratio shows that leveraged bulls continue to get caught on the wrong side of the range.
The long/short ratio sits at 0.96, nearly balanced with a slight short bias. Top traders on Binance maintain 3.45 long/short ratio, indicating larger accounts remain net long despite the correction.
JPMorgan Questions Upgrade Impact
Fundamental backdrop adds uncertainty. JPMorgan analysts noted that December’s Fusaka upgrade cut fees and increased transactions, but questioned whether the rebound can persist given competition from layer-2 networks and rival blockchains.
The bank warned that similar upgrades have historically failed to sustain network activity improvements. Competition from faster chains like Solana and the shift of activity to Base, Arbitrum, and Optimism continues to fragment capital away from Ethereum’s main layer.
The skepticism adds to the bearish narrative even as on-chain metrics show accumulation. Whether technical flows or fundamental concerns win out will determine direction in the coming weeks.
Ascending Channel Support Holds For Now
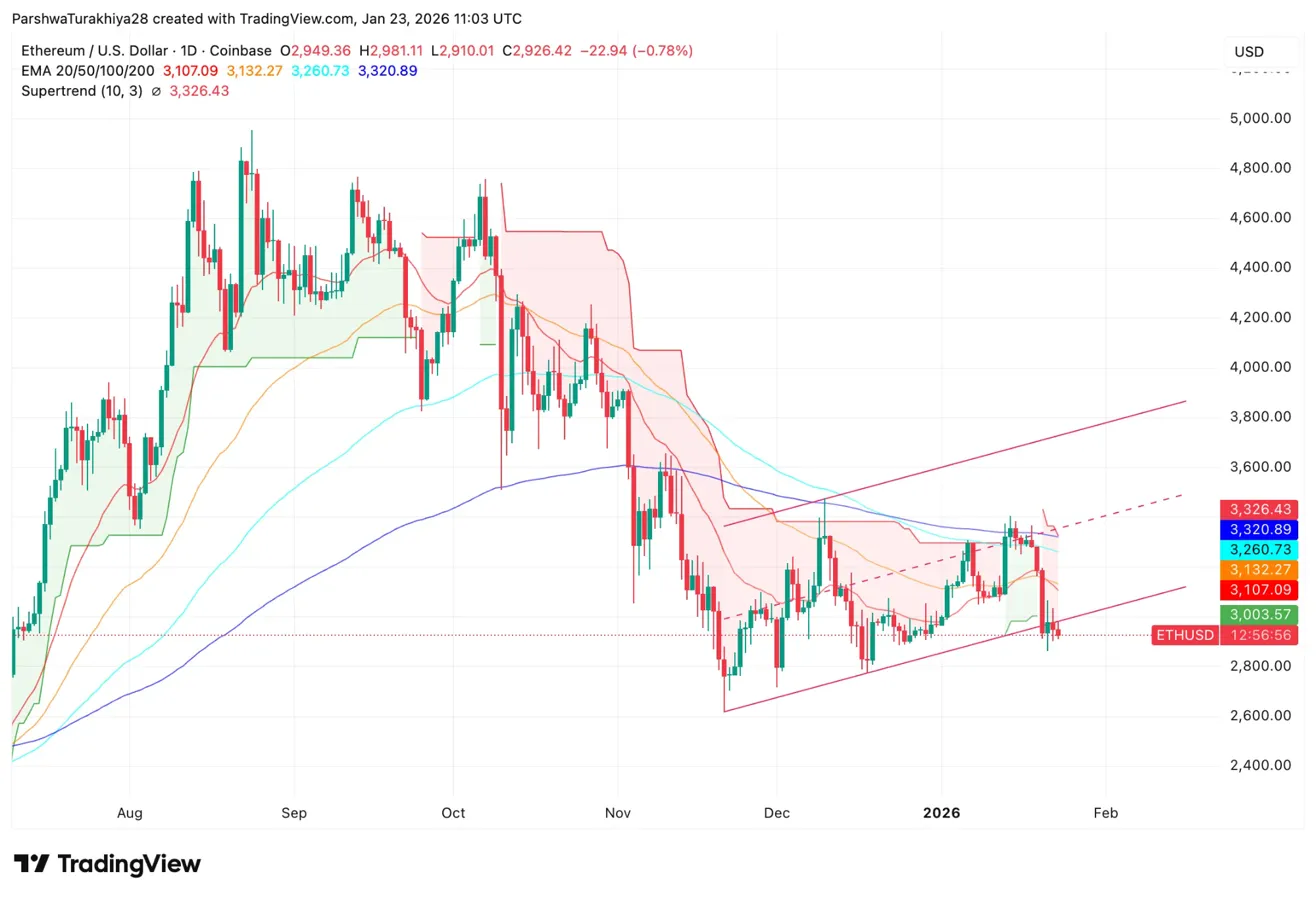
On the daily chart, Ethereum has traded inside an ascending channel since the December low near $2,600. The pattern shows higher lows with price currently testing the lower boundary for the third time this month.
Price remains below all four EMAs, confirming the short-term weakness:
- Immediate resistance: $3,107 (20 EMA)
- Secondary resistance: $3,132 (50 EMA)
- Major resistance: $3,260 (100 EMA)
- Supertrend resistance: $3,326
- Trend resistance: $3,320 (200 EMA)
- Channel support: $2,900 to $2,920
- Breakdown target: $2,600
The channel has contained the correction so far, with each test of support attracting buyers who defend the pattern. A fourth test risks breaking the structure if conviction weakens.
Intraday Structure Shows Descending Triangle
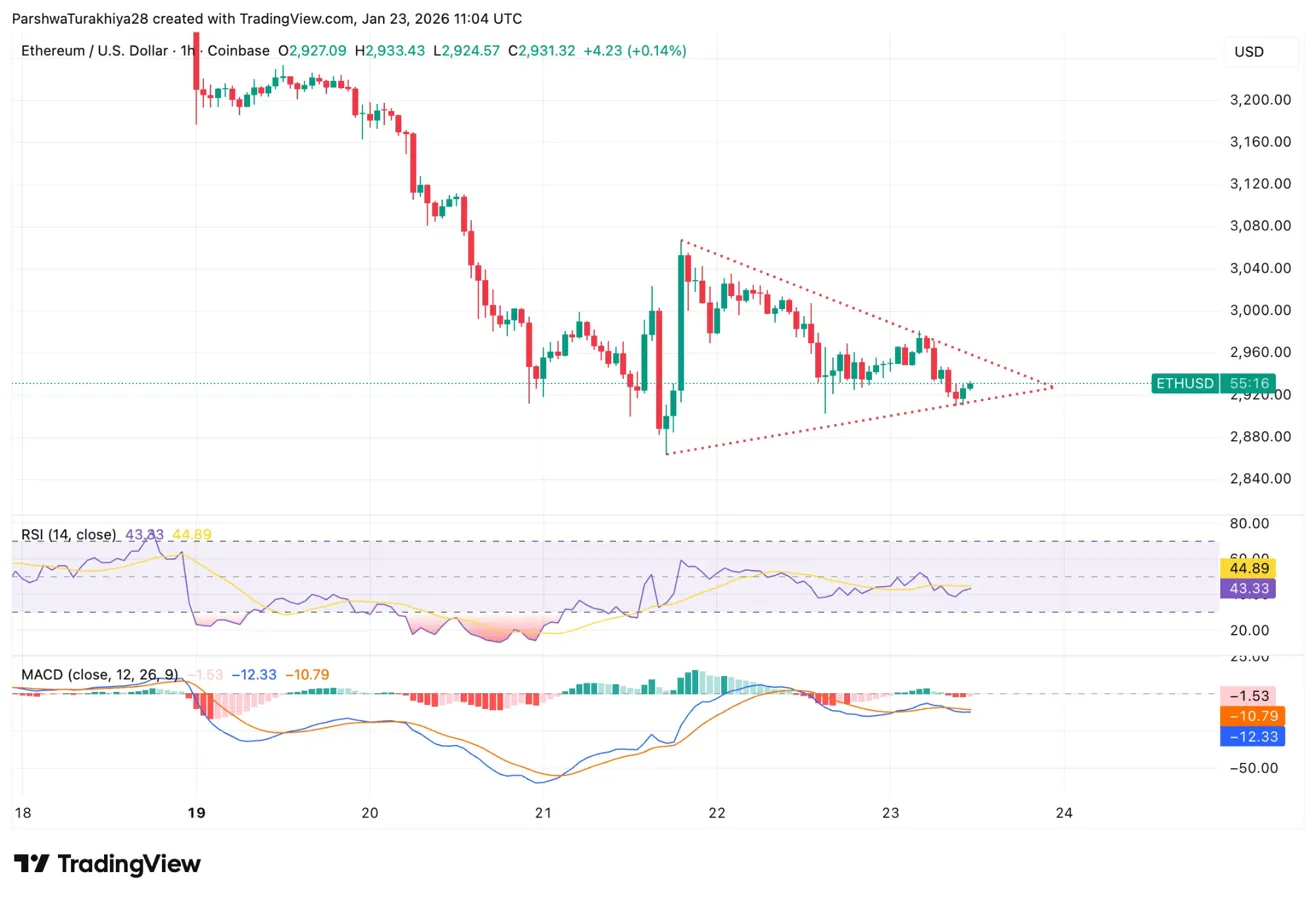
Shorter timeframes reveal near-term pressure. On the hourly chart, ETH has formed a descending triangle since the January 19 selloff. Price makes lower highs while support holds flat near $2,920.
RSI sits at 43.33, neutral territory without clear momentum. MACD remains bearish but the histogram is compressing, suggesting the downtrend may be losing steam.
The triangle typically resolves with breakdowns, but when formed at support levels, it can also mark reversal patterns. A break below $2,900 would confirm the bearish resolution and target $2,800. A break above $2,980 would invalidate the pattern and target $3,050.
Outlook: Will Channel Support Hold?
The setup shows accumulation meeting technical pressure. Spot inflows suggest buyers see value, but the descending triangle and JPMorgan skepticism create headwinds. The ascending channel support becomes the deciding level.
- Bullish case: Price bounces from $2,900 channel support and breaks the descending triangle to the upside. A close above $3,000 targets the 20 EMA at $3,107.
- Bearish case: Channel support breaks on the fourth test. A close below $2,900 confirms the breakdown and targets $2,800, with $2,600 exposed if selling accelerates.
Ethereum sits at the lower edge of its recovery range. Spot accumulation provides a bid, but the chart requires a hold above $2,900 to maintain the bullish structure.
Disclaimer: The information presented in this article is for informational and educational purposes only. The article does not constitute financial advice or advice of any kind. Coin Edition is not responsible for any losses incurred as a result of the utilization of content, products, or services mentioned. Readers are advised to exercise caution before taking any action related to the company.
 Price Prediction: XRP Stuck in Tight Range as Traders Watch $1.40 Support")
 Price Prediction: BTC Consolidates as Bulls Eye Breakout Above 72K")

 Price Prediction: Will Bulls Break Above 0.0635?")
