
- Ethereum breaks above short term resistance inside a triangle, with bulls targeting the $3,477 to $3,566 zone.
- Spot inflows turn positive with $71M entering the market as traders shift from distribution to accumulation.
- Futures open interest jumps 7.7 percent, showing rising leverage and bullish positioning across major exchanges.
Ethereum price today trades near $3,070 after breaking above a descending trendline that has contained every rebound since late October. The move gives buyers a short term advantage inside a large symmetrical triangle structure, but overhead resistance from the EMA cluster and Supertrend ceiling continues to limit momentum.
Trendline Break Gives Bulls First Technical Win In Weeks

The daily chart shows Ethereum pressing against a confluence of resistance levels. Price has reclaimed the $3,000 psychological threshold and is testing the underside of a trendline that intersects with the 20 and 50 day EMAs near $3,363 and $3,477. A decisive breakout above this zone would complete the triangle pattern and open the door toward the 200 day EMA near $3,566.
The Supertrend signal remains bearish at $3,382. Unless price clears that trigger, rallies can face renewed selling pressure, especially from algorithmic traders that have been active during recent trend inflections.
Support remains well defined. The rising lower boundary of the triangle intersects near $2,850. That level has held multiple tests during November and represents the primary structural floor.
Short Term Chart Shows Aggressive Breakout Attempt With Overbought Signals

The 1-hour chart provides a clearer view of intraday conditions. Ethereum broke above a descending trendline that rejected multiple rallies during November and early December. Price has moved sharply higher, but the RSI has reached overbought levels above 76, reflecting both strength and elevated risk of near-term pullback.
MACD remains bullish, with widening divergence and positive histogram bars. Buyers have regained short-term control, but continuation requires consolidation rather than another vertical move.
Related: Solana Price Prediction: Bulls Eye $155 as Breakout Aligns With Rising Net Inflows
If Ethereum fails to hold above $3,050 after a consolidation phase, the breakout becomes vulnerable to a sharp intraday reversal toward $2,950. Buyers must defend higher lows on shorter timeframes to maintain the breakout anatomy.
Spot Inflows Return As Market Turns Accumulative
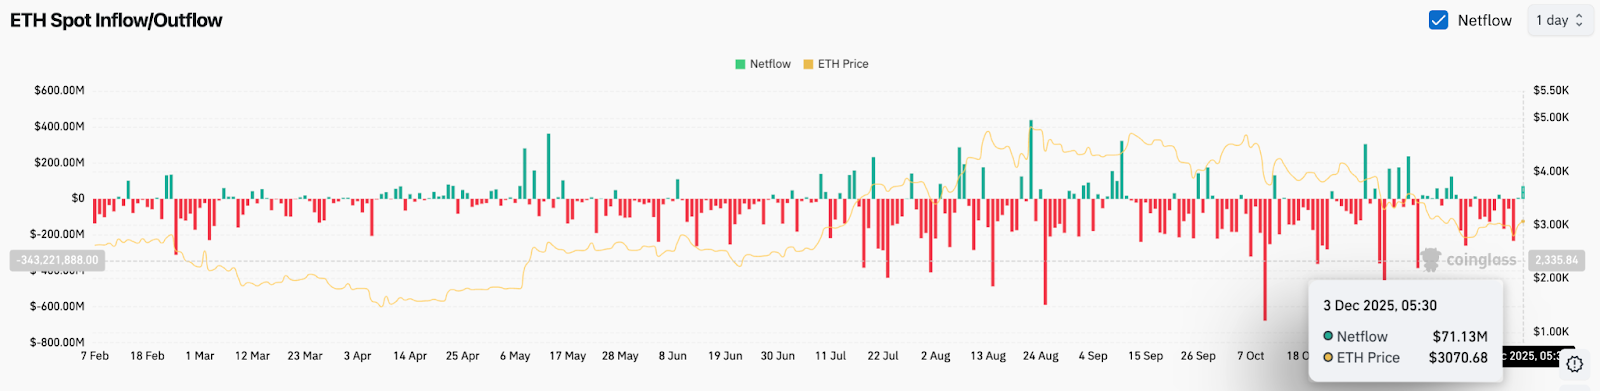
Spot flow data shows $71 million in net inflows on December 3. This marks a shift from the heavy distribution that dominated much of November and coincides with the break above resistance. Positive flows during a breakout historically improve the probability of continuation, particularly when inflows are sustained over multiple sessions.
HoweverRecent inflows are not large enough to define a trend, but they are meaningful because they emerge after weeks of persistent net outflows.
Futures Market Shows Rising Leverage And Increasing Risk Appetite
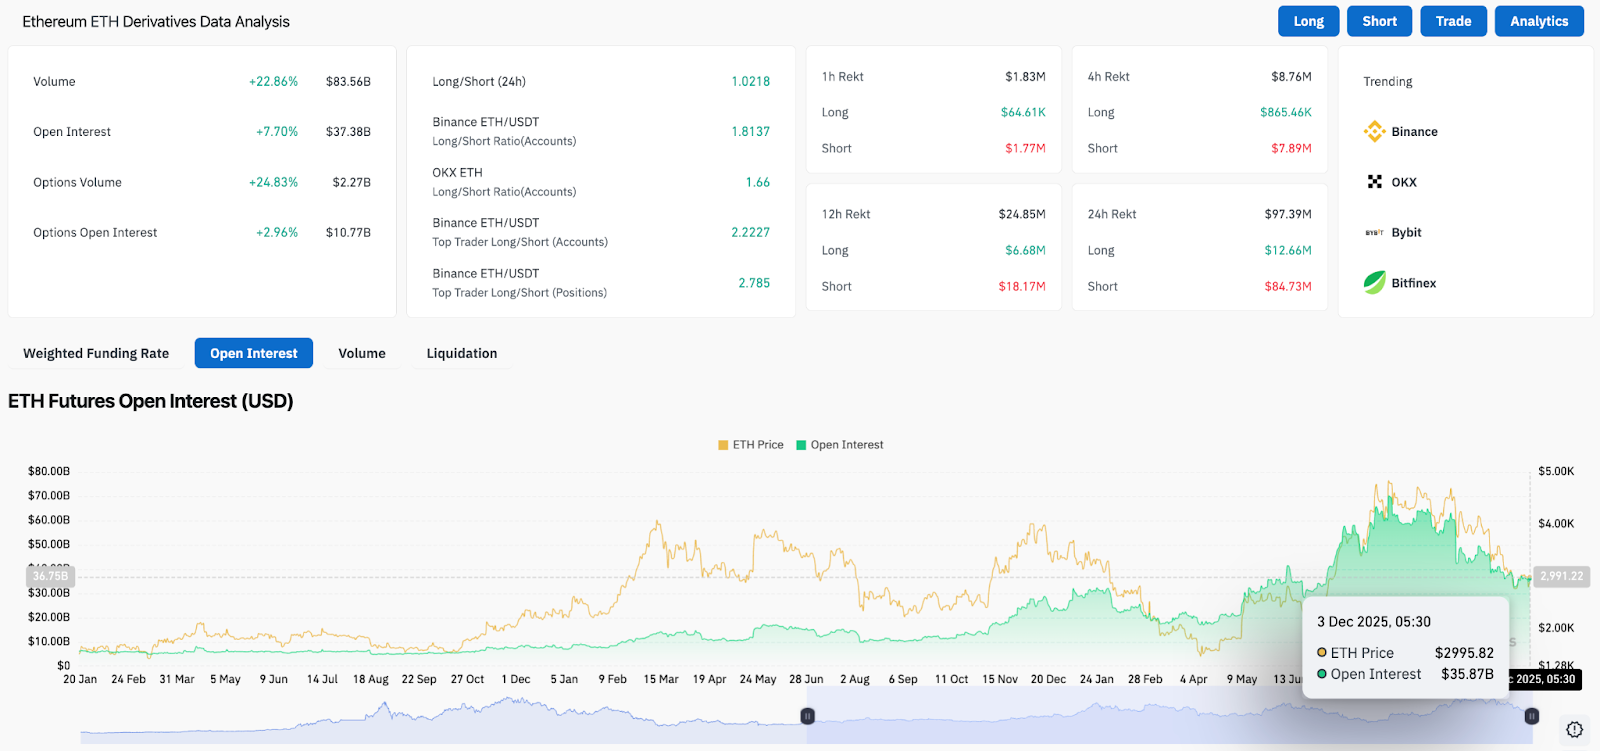
Derivatives data signals a change in positioning. Ethereum futures open interest has increased 7.7 percent to $37.38 billion, while volume is up more than 22 percent. Options activity rose nearly 25 percent, and open interest in options climbed toward $10.8 billion.
Long short ratios show bullish skew. Binance accounts show ratios above 1.8, with top trader positions rising toward 2.8. The shift indicates traders are adding long exposure rather than merely exiting shorts.
The risk is that leverage remains elevated and could unwind rapidly if price fails at resistance. However, rising leverage during an upside break often reflects participation and conviction rather than desperation.
The futures market is aligned with continuation, but sustained price gains require support from flows and spot volumes.
Outlook. Will Ethereum Go Up?
Ethereum has broken above short term resistance with improving flows and rising leverage, giving bulls their first legitimate opportunity to challenge primary resistance. Momentum favors continuation, but structure has not flipped from corrective to bullish.
- Bullish case: A clean break above $3,477 followed by a close above $3,566 triggers a trend reversal and opens the door toward $4,000 to $4,100.
- Bearish case: Failure at current resistance puts price back inside the triangle and risks a breakdown toward $2,850. A loss of that level exposes deeper downside toward $2,650.
If Ethereum reclaims the EMA cluster near $3,566 with rising volume, trend control shifts. Losing $2,850 turns the breakout into a failed pattern rather than a recovery.
Disclaimer: The information presented in this article is for informational and educational purposes only. The article does not constitute financial advice or advice of any kind. Coin Edition is not responsible for any losses incurred as a result of the utilization of content, products, or services mentioned. Readers are advised to exercise caution before taking any action related to the company.


