
- Ethereum holds bullish momentum, targeting key resistance at $2,780 and $2,800.
- MACD hints at a bullish crossover, while RSI signals growing buying interest.
- Derivatives trading volume surges, indicating heightened market participation.
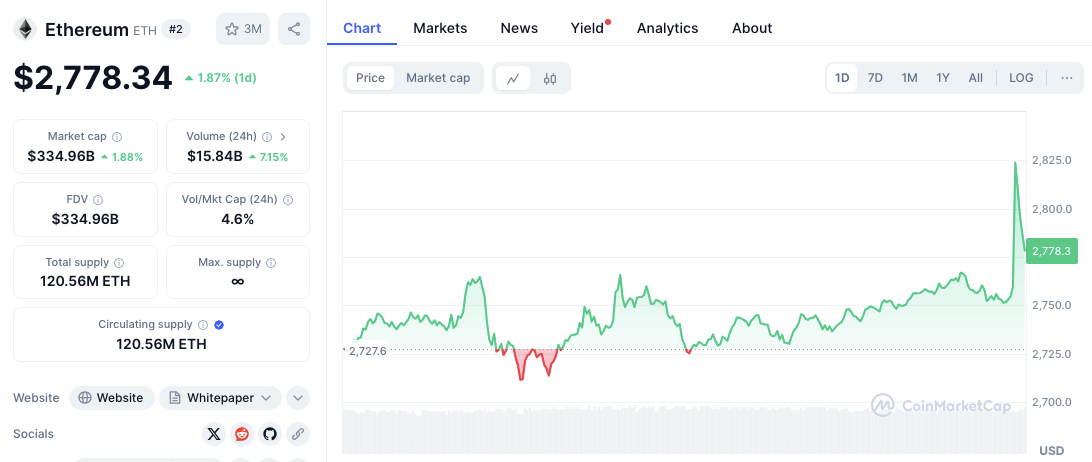
Ethereum (ETH) continues to show bullish momentum, with the price currently at $2,759.09—a 0.99% gain over the past 24 hours. The cryptocurrency’s market cap rises to $332.64 billion, and its 24-hour volume jumps 7.89% to $15.28 billion.
These movements point to growing buying interest as the market eyes resistance on February 22 and the potential to break through $2,800.
Ethereum’s Current Price Trend
The recent price action shows volatility along with an uptrend, marked by higher highs and higher lows—a sign of sustained bullishness.
Increasing trading volume supports the possibility of further gains, and if ETH holds above $2,750, it could move toward key resistance levels.
Related: Vitalik Buterin Praises Family’s Role in Ethereum’s Genesis
Key Support and Resistance Levels
Ethereum finds key support at $2,730, where multiple bounces signal strong buying pressure. Below this, $2,700 acts as a critical psychological level, while $2,660 marks the lowest point in the current timeframe.
On the resistance side, ETH approaches $2,780—a level where price has faced rejection before.
If the price breaks past this barrier, the next critical resistance is at $2,800, a psychological level that could signal further gains. Should ETH successfully breach this mark, the $2,850 level becomes the next key target, representing the upper limit of the current price range.
Technical Indicators Signal Potential Upside
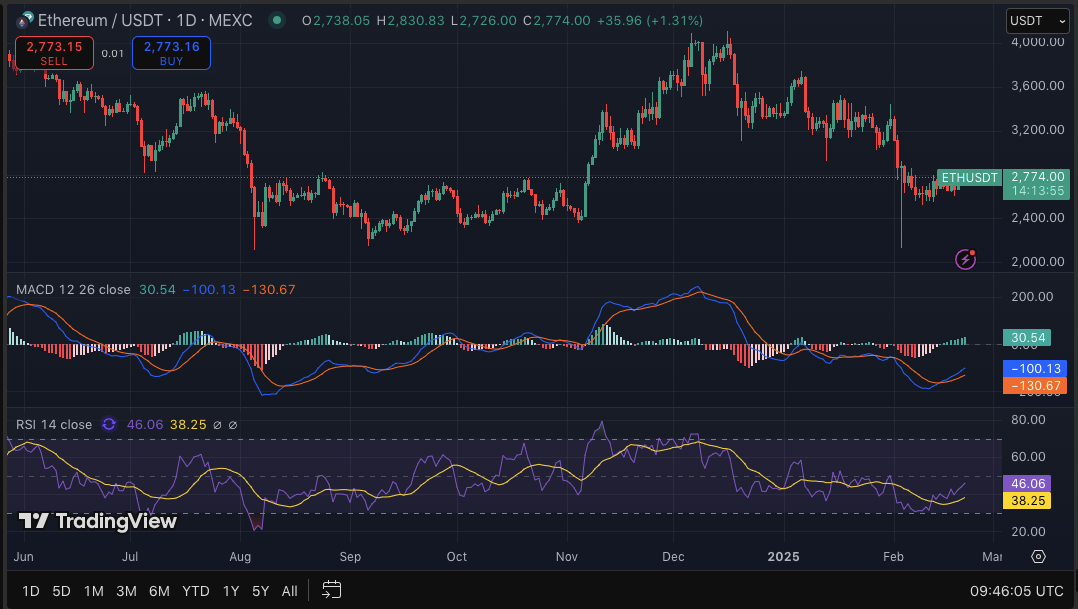
Ethereum’s technical indicators suggest a potential shift in momentum. The Relative Strength Index (RSI) currently stands at 48.19, indicating neutrality. Although it remains below the 50 threshold, signs of recovery suggest that buying pressure may be building. A move above 50 would strengthen the bullish case.
The Moving Average Convergence Divergence (MACD) indicator presents a potential bullish crossover. The MACD line sits at 32.90, while the signal line remains at -97.18. The histogram’s value of -130.08 indicates diminishing bearish momentum. If the MACD crosses above the signal line, Ethereum could gain additional upward traction.
Ethereum Derivatives Data Reflects Market Activity
Coinglass market sentiment remains optimistic, as Ethereum derivatives data highlights increased trading activity. Derivatives volume surged by 10.53% to reach $25.58 billion, while open interest rose by 4.11% to $25.66 billion.
Related: Analysis: Is Coinbase’s Shady Staking Affecting Ethereum’s Price?
Meanwhile, options volume grew by 2.44% to $653.94 million. However, options open interest declined by 6.54% to $6.59 billion, suggesting some traders may be securing profits.
Disclaimer: The information presented in this article is for informational and educational purposes only. The article does not constitute financial advice or advice of any kind. Coin Edition is not responsible for any losses incurred as a result of the utilization of content, products, or services mentioned. Readers are advised to exercise caution before taking any action related to the company.

 Price Prediction: Can Bulls Reclaim the 0.236 Level?")

 Price Prediction: Can Bulls Break the $329 Barrier?")
