
- Ethereum staking has increased to 28.9% in 2024, showing a rise in investor confidence and long-term commitment.
- Bullish sentiment in Ethereum’s derivatives market is evident with a 24.79% volume increase and a 0.29% rise in open interest.
- Despite recent price declines, technical indicators like RSI and MACD suggest a slowing of bearish momentum for Ethereum in 2024.
long-term confidence in Ethereum, especially with over 15% of staked ETH locked for more than three years.
This trend reflects a shift in investor behavior. While short-term staking was more common in early 2021, investors are now increasingly choosing to lock up their ETH for longer periods.
Increase in Long-Term Staking Reflects Confidence
IntoTheBlock’s report highlights a shift toward longer-term staking. In early 2021, many investors chose short-term staking. However, since mid-2022, there has been a growing trend toward medium and long-term staking, which shows increased confidence in Ethereum’s future potential.
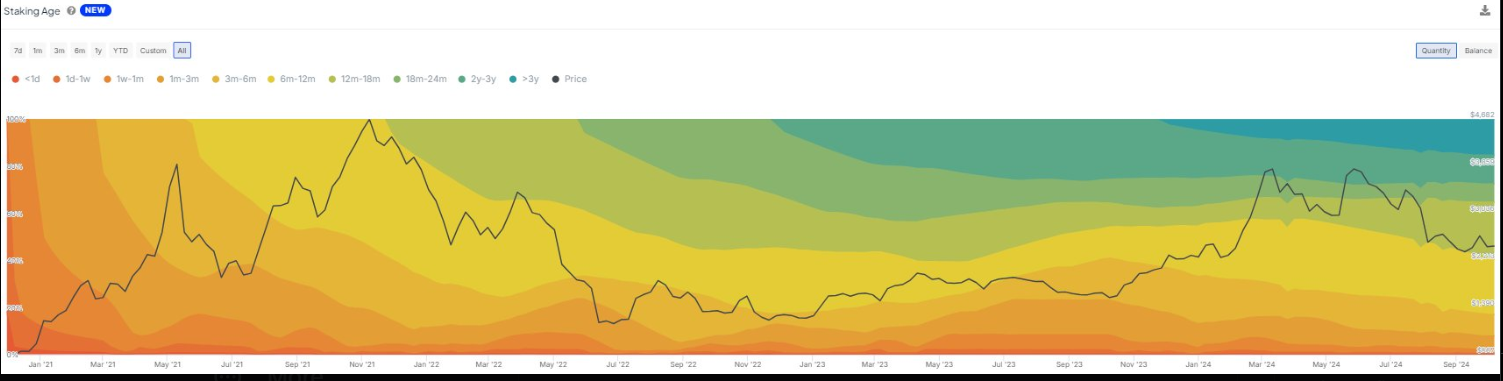
Source: IntoTheBlock
The report says that price fluctuations in ETH have affected staking behavior. When prices rise, staking durations tend to be longer, while price declines often lead to a reduction in staking activities.
Read also : 2024 U.S. Elections: Bitcoin, Ethereum Volatility and Regulatory Risks
Ethereum’s price is quoted at $2,430.72, with a 24-hour trading volume of $15.77 billion. This is a slight decline of 0.73% in the last 24 hours. Ethereum’s market capitalization is currently at $292.6 billion, with a circulating supply of over 120.3 million ETH.
Ethereum Derivatives Market Shows Bullish Sentiment
Along with rising staking levels, Ethereum’s derivatives market is looking bullish. Volume increased by 24.79% to $24.07 billion, and open interest rose by 0.29% to $11.46 billion. Options trading also surged, with a 6.35% rise in volume and a 1.48% increase in open interest.
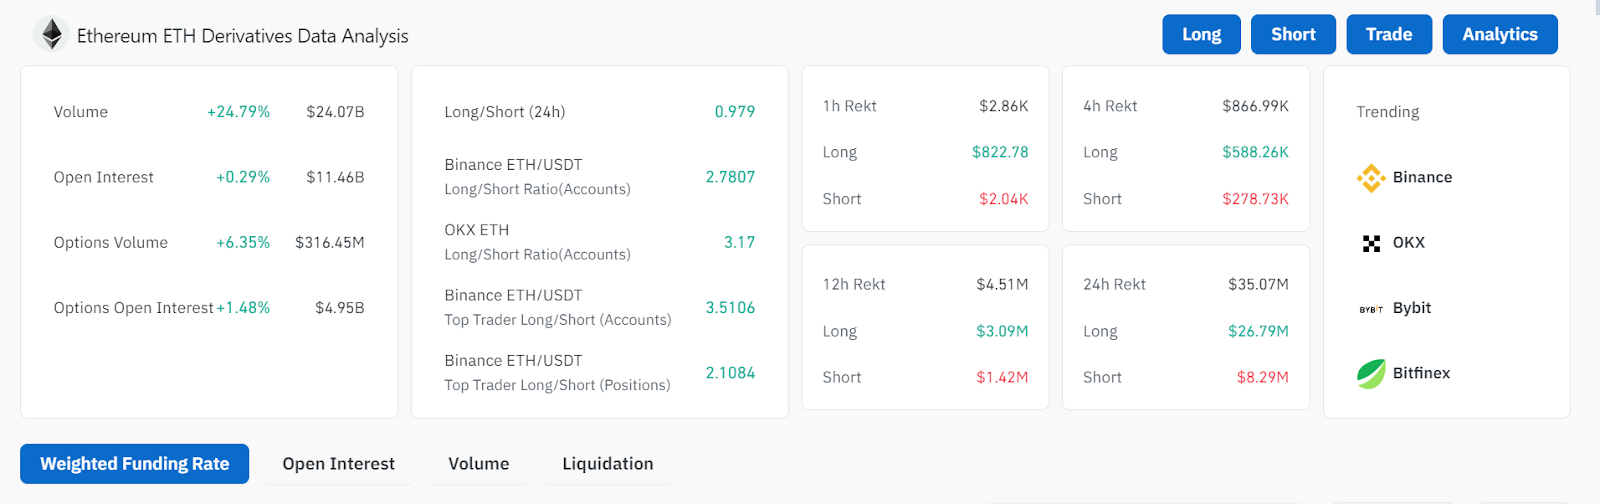
Source: Coinglass
The long/short ratio in the derivatives market is at 0.979, showing a balanced outlook overall. However, platforms such as Binance and OKX show a stronger bullish sentiment, with long/short ratios of 2.78 and 3.17, respectively. In the past 24 hours, $35.07 million worth of short positions were liquidated, adding to the growing confidence among traders.
Price Movements and Technical Indicators
Ethereum’s price chart from April to October 2024 shows a period of fluctuations. Peaks happened around mid-May and mid-July, followed by notable declines in August and September. The price has since stabilized at $2,428, suggesting a bearish trend in recent months after reaching highs above $3,500 earlier this year.
Also, Ethereum’s trading volume has been moderate, with lower volatility than earlier periods. The Relative Strength Index (RSI) is currently at 45.23, slightly below the neutral level of 50. This indicates a weak bearish momentum but not enough to signal that Ethereum is oversold.
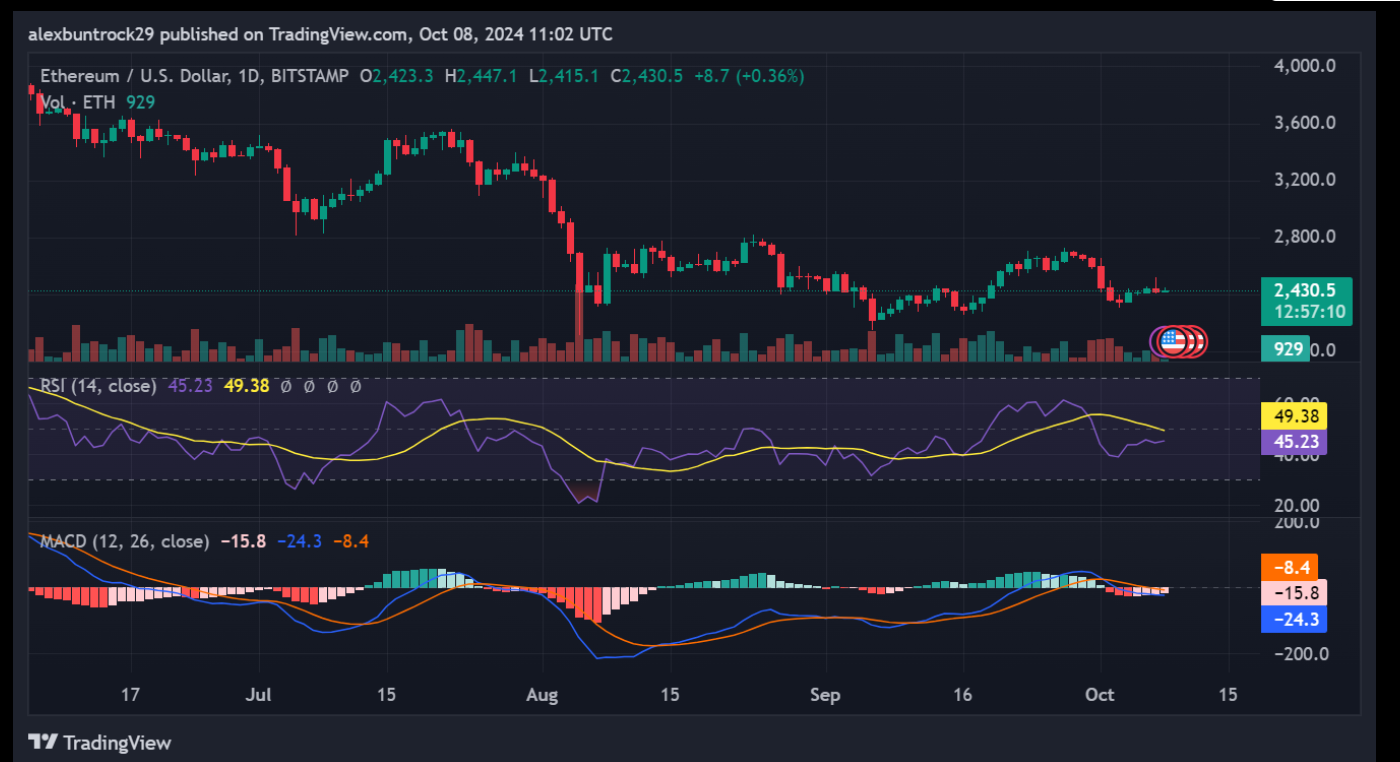
Source: TradingView
The Moving Average Convergence Divergence (MACD) is in negative territory, with a MACD line of -15.8 and a signal line of -8.4. The histogram, which tracks the difference between the MACD and signal lines, is at -24.3. Although bearish momentum persists, the decreasing negative bars suggest the downward trend may be slowing.
Disclaimer: The information presented in this article is for informational and educational purposes only. The article does not constitute financial advice or advice of any kind. Coin Edition is not responsible for any losses incurred as a result of the utilization of content, products, or services mentioned. Readers are advised to exercise caution before taking any action related to the company.


