
- Ethereum Foundation’s 1,050 ETH sale in September signals strategic market timing.
- ETH price holds firm at $2,593 support, with potential resistance at $2,700 ahead.
- Bullish signals emerge as MACD rises and RSI remains neutral for further momentum.
The Ethereum Foundation has once again sold a significant amount of ETH, this time 100 ETH at $2,645, according to PANews data. This brings the total Ethereum (ETH) sold by the Foundation to 1,050 ETH in September alone, valued at roughly $2.53 million.
These sales took place at prices between $2,301 and $2,645, suggesting a strategic selling approach during Ethereum’s price swings. These transactions raise questions about their potential impact on the market, especially as ETH shows signs of recovery.
Ethereum Price Trend and Market Activity
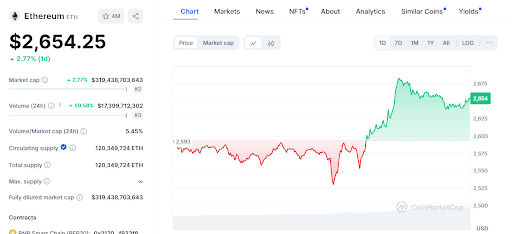
As at presstime, Ethereum’s current price stands at $2,651.16, reflecting a 2.23% increase over the past 24 hours. Importantly, this upward movement comes after a period of volatility where ETH briefly tested a support level near $2,593 before bouncing back.
Daily trading volume has jumped by 59.85%, reaching $17.35 billion. This significant rise in trading activity indicates increased market interest and the possibility of more volatility as investors react to the Foundation’s selling.
Read also: Ethereum’s Circulating Supply Increases, Price Remains Volatile
Bullish Momentum Builds, But Challenges Remain
The recent bounce from the $2,593 support level has created bullish momentum, pushing ETH towards a local high of $2,675. However, the price slightly retreated and settled around $2,651. Even with this small pullback, the $2,593 support level has held firm and may continue to be a crucial price zone in the near term.
Several support and resistance levels are emerging as important markers in Ethereum’s price trend. The support at $2,593 proved its significance when the price bounced from this level. In addition, another key support level to watch is $2,550, which could provide support if $2,593 doesn’t hold.
Read also: Ethereum’s ‘Parasitic’ Relationship with L2s: Expert’s Take
Looking ahead, ETH faces immediate resistance at $2,675, where the price was briefly rejected. If it breaks through this level, the next target would be the psychological resistance at $2,700. Overcoming this point could lead to further gains, potentially driving ETH higher in the coming days.
Technical Indicators Point to Bullish Trend
Ethereum’s 1-day Relative Strength Index (RSI) is currently at 60.49, placing it in neutral territory. This reading suggests that the market is neither overbought nor oversold, leaving room for further price movement.
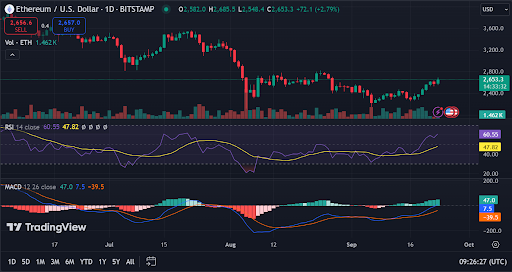
Additionally, the Moving Average Convergence Divergence (MACD) is trading above the signal line, indicating growing bullish momentum.
Disclaimer: The information presented in this article is for informational and educational purposes only. The article does not constitute financial advice or advice of any kind. Coin Edition is not responsible for any losses incurred as a result of the utilization of content, products, or services mentioned. Readers are advised to exercise caution before taking any action related to the company.


