


- Market instability rises as Ethereum Foundation sells ETH.
- ETH price hovers around $3,000 after recent foundation sales.
- Indicators hint at a potential bullish reversal amid ETH uncertainty.
The Ethereum Foundation’s recent series of transfers to the multisign address “0xbc9” has drawn market observers’ attention. Spot On Chain reports the foundation recently moved 1,000 ETH, valued at $3 million, to this address. Since the start of 2024, it has transferred 5,000 ETH in total to this location.
These transactions could impact the market, as previous trends suggest. Of the ETH moved previously to this address, 1,766 ETH have been sold for 4.81 million DAI, averaging $2,725 per ETH. According to analysis, the foundation’s actions often align with drops in Ethereum’s price.
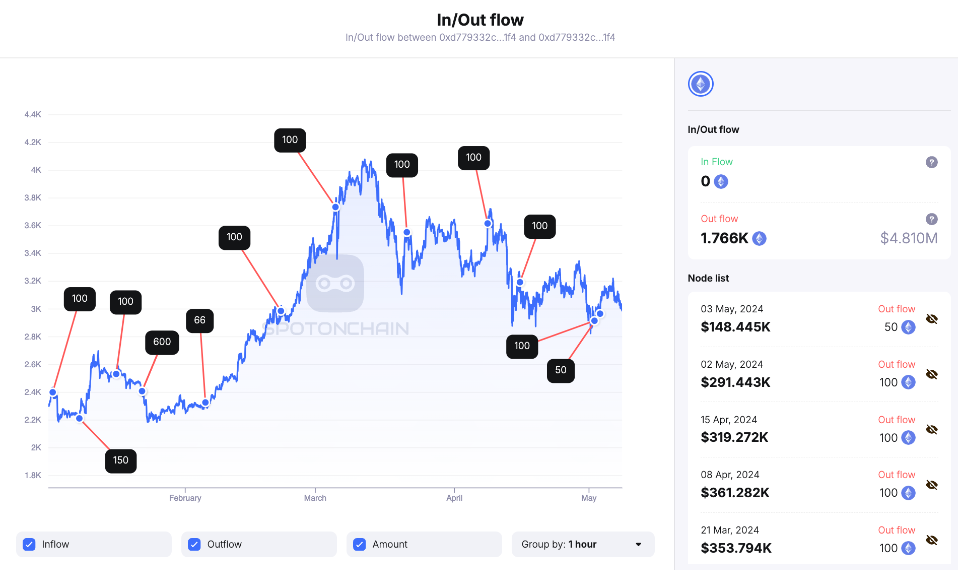
In/Out flow (Source: Spot On Chain)
Presently, the multisign address “0xbc9” holds 2,508 ETH, or $7.51 million. Given the foundation’s sales history and their effect on Ethereum’s value, market participants are closely monitoring the situation.
Analysts suggest that the correlation between the Ethereum Foundation’s activity and the market fluctuations could indicate further changes. Historical data supports this view, as significant sell-offs have often resulted in downward pressure on the cryptocurrency’s price.
ETH Market Reacts
Following the mass sell-off, the Ethereum market is showing signs of instability and increased volatility. In the last 24 hours, ETH has struggled to maintain its price above the $3,000 mark. Nevertheless, some analysts remain optimistic about a potential rebound.
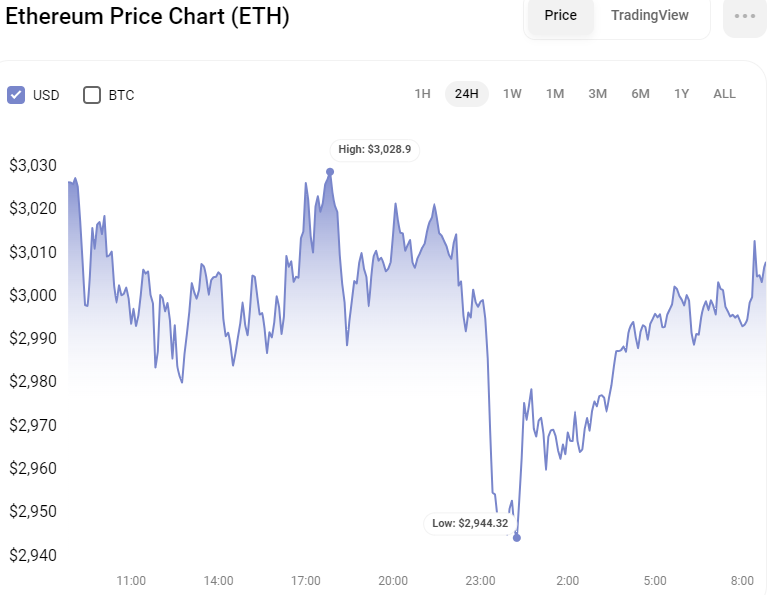
ETH/USD 24-Hour Chart (Source: CoinStats)
As of press time, ETH is trading at $3,008. 09, reflecting a 0.6% drop from the previous day’s close. This minor decline has also affected ETH’s intraday market capitalization, which has reduced by 0. 70%. Despite this, Ethereum remains the second-largest cryptocurrency by market cap.
Due to these price movements, ETH’s current market capitalization rests at $360.95 billion. In the same way, ETH’s trading volume has also decreased a bit, falling by 0.35% to $11.39 billion. This present low level of ETH market activity indicates that investors are now cautious, probably waiting until more developments come up before they make big investments.
Is a Revival in Sight for ETH?
Recent technical analysis of Ethereum (ETH) reveals a bearish sentiment in the short term, indicated by the MACD and RSI. The MACD is positioned at -25.31, below the signal line, highlighting the bearish mood. However, the MACD line is beginning to shift direction upward, nearing a crossover with the signal line, suggesting a weakening bearish trend and potential reversal.
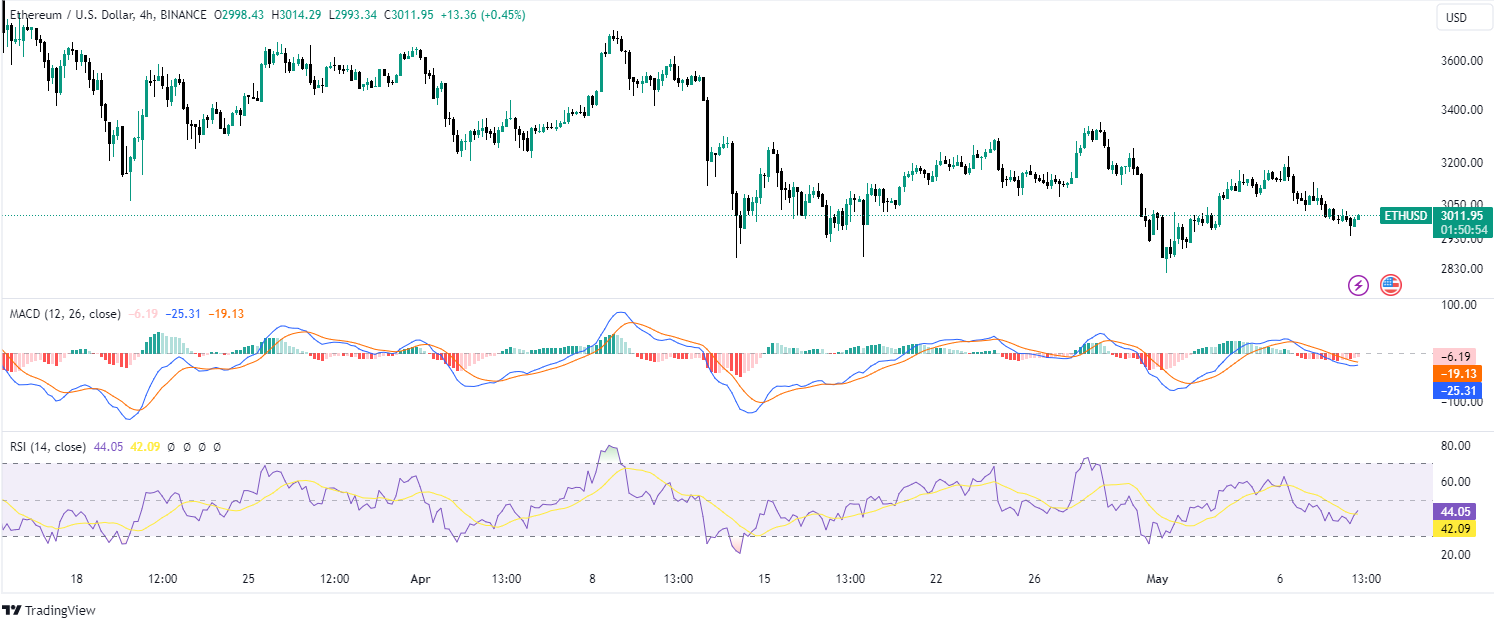
ETH/USD 4-Hour Chart (Source: Tradingview)
Additionally, the MACD histogram chart reinforces this observation. The chart shows narrowing bars approaching the zero line, hinting at a momentum shift from bearish to bullish. This narrowing indicates that the bearish trend is losing strength, leading to a potential crossover that could ignite a bullish reversal.
Further analysis reveals that the RSI indicator also reflects a similar sentiment. Positioned at 44.05 and moving vertically above the signal line, the RSI shows increasing buying pressure in the market. The current position below the overbought threshold signals room for further upward movement before becoming overbought, indicating that a bullish trend may emerge.
Disclaimer: The information presented in this article is for informational and educational purposes only. The article does not constitute financial advice or advice of any kind. Coin Edition is not responsible for any losses incurred as a result of the utilization of content, products, or services mentioned. Readers are advised to exercise caution before taking any action related to the company.

 Price Prediction 2024-2030: Will XRP Price Hit $1 Soon?")


