


- Bullish Flow (FLOW) price prediction ranges from $0.6536 to $3.200
- Analysis suggests that the FLOW price might reach above $3 soon.
- The FLOW bearish market price prediction for 2023 is $0.65.
Flow is a blockchain project that was launched as a complement to the Ethereum blockchain. Its native token FLOW is used in the payment of transaction fees within the Flow network.
Flow investors are bullish on the token since it has had a return on investment (ROI) of over 26 times in the past 2 years. The crypto boom of 2021, led to the price increase in FLOW to its present all-time high (ATH) of $46.16 which was attained in April 2021. Irrespective of the recent crypto winter in 2022, FLOW investors are confident that the future of FLOW is bullish.
If you are interested in the future of Flow (FLOW) and would want to know the price analysis and price prediction of FLOW for 2023, 2024, 2025, 2026, up to 2030, keep reading this CoinEdition article.
Table of contents
- Flow (FLOW) Market Overview
- What is Flow (FLOW)?
- Flow Current Market Status
- Flow Price Analysis 2023
- Flow Price Prediction 2023 – 2030 Overview
- Flow Price Prediction 2023
- Flow Price Prediction 2024
- Flow Price Prediction 2025
- Flow Price Prediction 2026
- Flow Price Prediction 2027
- Flow Price Prediction 2028
- Flow Price Prediction 2029
- Flow Price Prediction 2030
- Flow Price Prediction 2040
- Flow Price Prediction 2050
- Conclusion
- FAQ
- More Crypto Price Predictions:
Flow (FLOW) Market Overview
| 🪙 Name | Flow |
| 💱 Symbol | FLOW |
| 🏅 Rank | #65 |
| 💲 Price | $0.867707955714 |
| 📊 Price Change (1h) | -0.11 % |
| 📊 Price Change (24h) | -4.01 % |
| 📊 Price Change (7d) | -9.44 % |
| 💵 Market Cap | $1304419813.89 |
| 💸 Circulating Supply | 1503293597 FLOW |
| 💰 Total Supply | 1503293596.79 FLOW |
Flow (FLOW) is currently trading at $0.867707955714 and sits at number #65 on CoinMarketCap in terms of market capitalization. There are 1503293597 FLOW coins currently in circulation, bringing the total market cap to $1304419813.89.
Over the past 24 hours, Flow has decreased by 4.01%. Looking at the last week, the coin is down by 9.44%.
What is Flow (FLOW)?
Flow is a developer-friendly decentralized layer-one blockchain that is designed as the foundation for a new generation of games, apps, and digital assets.
Flow (FLOW) was launched in 2020 by the creators of CryptoKitties. It is present in both Flow and Ethereum blockchains. The flow community is made up of Web3 builders and creators of top brands.
Some of the top partners in the Flow network are Rarible, Shopify, Gaia, Blocto, Eternal, Alchemy, and Mint. Instagram, Mixi, and others. It has a $725 ecosystem fund as grants to developers that wish to build on the Flow blockchain.
The Flow blockchain uses HotStuff which is one of the greenest Proof-of-Stake mechanisms to lower the emission of carbon in minting non-fungible tokens (NFTs). This adds a unique multi-node architecture to its consensus mechanism, therefore, increasing the throughput, environmental friendliness, and speed of the network unlike other Sharding and layer 2 platforms.
On the flow blockchain, the creation of a Smart User Account gives decentralized applications (DApps) and wallets the ability to recover lost keys of their users. This is unlike what is obtainable in most blockchains. Its human-readable security ensures that users are protected from malicious apps.
Flow Current Market Status
The maximum supply of Flow (FLOW) is unknown while its circulating supply is 1,036,200,000 FLOW coins according to CoinMarketCap. At the time of writing, FLOW is trading for $0.9563 which represents 24 hours increase of 4.66%. The trading volume of Flow in the past 24 hours is $44,072,523 which represents a 3.54% increase.
Some of the top cryptocurrencies for trading Flow (FLOW) are Binance, Kraken, Coinbase, Kucoin, Gate.io, and others.
Now that you have known what FLOW is and its current market status, we shall discuss the price analysis of Flow (FLOW) for 2023.
Flow Price Analysis 2023
Currently, FLOW is ranked in the 52nd position on CoinMarketCap. Will developments and upgrades within the Flow community lead to rising in the price of Flow (FLOW)? We shall see this in this Coin Edition price analysis 2023 article.
Flow Price Analysis – Keltner Channel
The Keltner channel is a technical indicator introduced by American grain trader, Chester W. Keltner to gauge the volatility of the market. For this purpose, it has three bands; the Upper band, Middle band (EMA), and lower band.
The upper band is calculated by adding twice the Average True Range (ATR) to the EMA (middle band), while the lower band is calculated by subtracting twice the ATR from the EMA. Moreover, the Keltner bands could also be used to determine the direction of the price movement.

The chart above shows two red rectangles that denote the expansion and contraction of the Keltner channels. When the bands widen it means that there is going to be more volatility. Or in other words, the prices could drastically drop or increase. When the bands squeeze, there could be less volatility. This is because the range of fluctuation would be restricted and the prices will be constrained to move sideways.
Additionally, when the price of a cryptocurrency continuously touches the upper or lower band and thereafter touches the opposite band, (which is, if a cryptocurrency continuously touches the upper band and finally touches the lower band, then we could determine that the bullish trend has faded.) This applies vice-versa as well. This behavior could be seen inside the green rectangle.
Currently, FLOW is testing the lower band, hence, there could be a trend reversal awaiting FLOW. Since this is the initial stage of testing the lower band, we could expect FLOW to test the lower band a few more times before the trend reverses.
However, although it is hard to adjudicate when the trend reversal could take place, it is more likely that FLOW may rise in price and move toward the middle band. If the Bulls are strong, then FLOW could move into the first half of the Keltner channel.
Additionally, as the bands are constricting, the price fluctuation could be limited even in the event of a trend reversal. Traders may want to consider this and focus more on volume to make the most of this scenario.
Flow Price Analysis – Bollinger Bands
The Bollinger bands are a type of price envelope developed by John Bollinger. It gives a range with an upper and lower limit for the price to fluctuate. The Bollinger bands work on the principle of standard deviation and period (time). The upper band as shown in the chart is calculated by adding two times the standard deviation to the Simple Moving Average while the lower band is calculated by subtracting two times the standard deviation from the Simple Moving Average.

When this setup is used in a cryptocurrency chart, we could expect the price of the cryptocurrency to abide within the upper and lower bounds of the Bollinger bands 95% of the time.
The above thesis is derived from an Empirical law also known as the three-sigma rule or the 68-95-99.7 which states that almost all observed data for a normal distribution (normal scattering of data) will fall within three standard deviations.
As such for a data set that follows a normal distribution, 68% of data will fall within 1 standard deviation of the mean, while 95% of data for the normal distribution will fall within 2 standard deviations of the mean and 99.7% of data will fall within 3 standard deviations of the mean.
Hence, as the Bollinger bands are calculated using two standard deviations, we could expect FLOW to abide within the Bollinger bands 95% of the time. (i.e whenever the cryptocurrency touched the upper band, the chances of it coming down are 95%.). This concept applies vice-versa as well.
Moreover, the sections highlighted by red rectangles show how the bands expand and contract. When the bands widen, we could expect more volatility, and when the bands contract, it denotes less volatility. Currently, the bands are opening up after being in a closed position.
This could indicate that there is going to be more volatility for FLOW in the future. Since FLOW has touched the lower band, the market could correct the price and FLOW could increase in value. This presents an excellent opportunity for those looking to short. However, it is vital to time the entry point to seize the opportunity.
Notably, the Bollinger Band behaves very closely with the Keltner channel. For instance, if you were to use both the Bollinger bands and Keltner channel indicators for a cryptocurrency, you would see that almost most of the time both indicators overlap. However, the only difference between with Bollinger band and the Keltner channel is that the Bollinger bands use Standard Deviation while the Keltner channel uses Average True Range for calculating its bands which are the top and bottom limits.
Flow Price Analysis – Relative Strength Index
The Relative Strength Index is an indicator that is used to find out whether the price of a security is overvalued or undervalued. As per its name, RSI indicators help determine how the security is doing at present, relative to its previous price.
Moreover, it has a signal line which is a Simple Moving Average (SMA) that acts as a yardstick or reference to the RSI line. Hence, whenever the RSI line is above the SMA it is considered bullish and if it’s below the SMA then it is bearish.
When considering the first green rectangle from the left of the chart below we can see that the RSI line (purple) is above the Signal line (yellow). As such, FLOW is bullish or gaining value as its making higher highs. The second green rectangle shows that the RSI is below the signal. Hence, FLOW is bearish as it is making lower lows.
Currently, the RSI is below the Signal line. However, the RSI is at 44.23 and is tilting upwards, hence, we could expect the FLOW prices to increase.
Moreover, the RSI compares the gains of the securities against the losses it made in the past. This ratio of gains against the losses is then deducted from the 100.
If the answer is less than 30, then we call that the price of the security is in the oversold region. This means that many are selling the security in the market, and as such the security is undervalued. Moreover, as per the Supply-demand curve theory, the price is supposed to drop when there is an increase in supply.
If the answer is more than 70 then the security is overbought as many are buying. Since many want to buy the security the demand increases which intuitively increases the prices.
Additionally, the RSI could be used to determine how strong a trend is. For instance, when a cryptocurrency is bullish or reaching higher highs, then the RSI line also should be making higher highs in unison.
For instance, if the RSI is making lower highs when the cryptocurrency is making higher highs, then we may say that although the token/coin is on a bullish trend it is losing value. As such, there could be a trend reversal in the future.
However, the RSI could also give false alarms for breakouts. Although we may expect, the prices to retrace if it goes to the oversold or overbought region, the prices also can stay in the oversold or overbought region for an extended period. As such, traders should be wary of it and let the market saturate before making vital decisions.
Flow Price Prediction – Moving Averages
The Exponential Moving averages are quite similar to the simple moving averages (SMA). However, the SMA equally distributes down all values whereas the Exponential Moving Average gives more weightage to the current prices. Since SMA undermines the weightage of the present price, the EMA is used in price movements.
The 200-day MA is considered to be the long-term moving average while the 50-day MA is considered the short-term moving average in trading. Based on how these two lines behave, the strength of the cryptocurrency or the trend can be determined on average.
In particular, when the short-term moving average (50-day MA) approaches the long-term moving average (200-day MA) from below and crosses it, we call it a Golden Cross. Contrastingly, when the short-term moving average crosses the long-term moving average from above then, a death cross occurs.
Usually, when a Golden Cross occurs, the prices of the cryptocurrency will shoot up drastically, but when there’s a Death Cross, the prices will crash.
Whenever the price of cryptocurrency is above the 50-day or 200-day MA, or above both we may say that the coin is bullish. Contrastingly, if the token is below the 50-day or 200-day, or below both, then we could call it bearish (Green triangle section).
When considering the red rectangle, FLOW was above the 50-day MA. Hence we could say that it was bullish in the short term. However, FLOW is currently testing the 50-day after falling below both moving averages. Moreover, the 50-day MA and the 200-day MA are in close quarters, but they are parallel to each other. However, if the 50-day MA approaches the 200-day MA above it, then a Golden cross could occur.
If the preceding happens, then FLOW prices could surge dramatically. This might give enough momentum to FLOW to break above both moving averages.
Flow Price Prediction 2023 – 2030 Overview
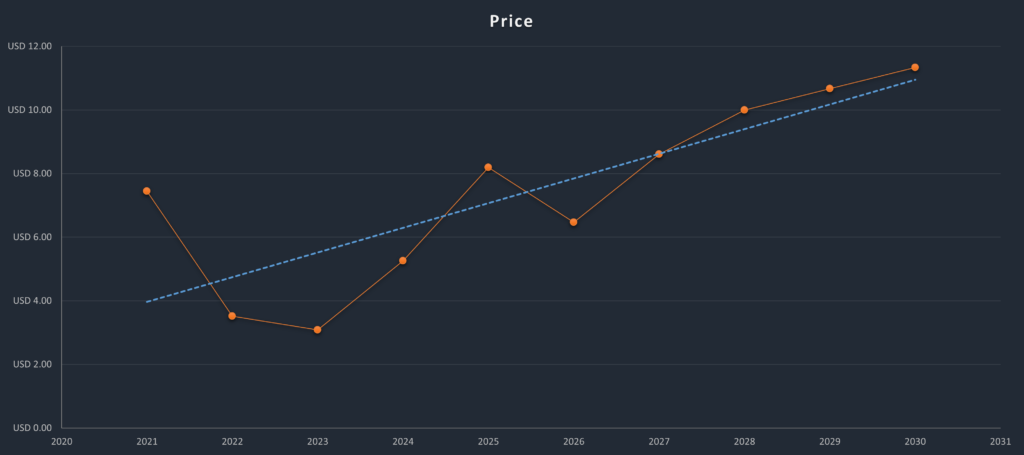
| Year | Minimum Price | Average Price | Maximum Price |
| 2023 | $1.25 | $3.09 | $4.15 |
| 2024 | $4.45 | $5.26 | $6.135 |
| 2025 | $7.150 | $8.19 | $9.125 |
| 2026 | $5.147 | $6.47 | $ 7.75 |
| 2027 | $7.95 | $8.61 | $9.162 |
| 2028 | $9.78 | $10.00 | $10.5 |
| 2029 | $10.58 | $10.67 | $11.29 |
| 2030 | $11.32 | $11.33 | $15.19 |
| 2040 | $24 | $28 | $30 |
| 2050 | $36 | $38 | $40 |
Flow Price Prediction 2023
When looking at the chart above we could see that FLOW traded taking the shape of a head and shoulders pattern from June 2022 to November 2022. During the formation of this pattern, FLOW tested Resistance 3 ≈ at $3.086 with the formation of its head while both its shoulders tested Resistance 2 at ≈$2.123. But just after forming the right shoulder FLOW descended and reached Support 1 at ≈ $ 0.653 in December.
As such FLOW is currently trading between Resistance 1 and Support 1. Interestingly, it has formed another head and shoulders pattern within these preceding resistance and support zone. However, the latter head and shoulders pattern seems to be shrunk.
But the question is, just as FLOW decreased in price after forming the last head and shoulders pattern, will FLOW fall this time again after forming the right shoulder? If it does fall it may resort the assistance of Support 1. If Support 1 comes to FLOW’s rescue, then the token might rebound off of Support 1 and move sideways.
However, the fall of FLOW is negated by the Bollinger bands as FLOW has touched the lower band and is due for a reversal —upwards movement.
If FLOW is to increase it may test Resistance 1 at ≈$1.8 but before its tests Resistance 1 there lies a weak Resistance at ≈$1.5, which may intrude FLOW’s path.
There lies another possibility where FLOW might break Resistance 1 and test Resistance 2 at ≈$2.123. However, with an impending Golden Cross, we could even expect FLOW to break Resistance 1 and 2 and reach Resistance 3 at ≈ $3.1.
Flow Price Prediction – Resistance and Support Levels
When looking at the chart above we could see how FLOW was sandwiched between the trend line and the outside of the arc since August 2021 to early 2022. However, Resistance 1 which then acted as a Support helped FLOW gain momentum. As such FLOW was able to slow down its crashing prices. As such FLOW which was fluctuating below the arc was able to break the arc and trade inside of it as shown in the chart.
Had not FLOW received support from Resistance 1 which acted as a Support to FLOW on its way, then FLOW would have taken the path as shown by the yellow broken lines.
Nonetheless, thanks to Resistance 1 that retarded FLOW’s crash. Currently, FLOW has been heavily depending on Support 1 at $0.6. Since late June 2022, FLOW has been sustained by Support 1.
Flow Price Prediction 2024
There will be Bitcoin halving in 2024, and hence we should expect a positive trend in the market due to user sentiments and the quest by investors to accumulate more of the coin. Since the Bitcoin trend affects the direction of trade of other cryptocurrencies, we could expect FLOW to trade at a price not below $5.26 by the end of 2024.
Flow Price Prediction 2025
FLOW may still experience the after-effects of the Bitcoin halving and is expected to trade above its 2024 price. Many trade analysts speculate that BTC halving could create a huge impact on the crypto market. Moreover, similar to many altcoins, FLOW will continue to rise in 2025 forming new resistance levels. It is expected that FLOW would trade beyond the $8.19 level.
Flow Price Prediction 2026
It is expected that after a long period of bull run, the bears would come into power and start negatively impacting the cryptocurrencies. During this bearish sentiment, FLOW could tumble into its support regions. During this period of price correction, FLOW could lose momentum and be a little below its 2025 price. As such it could be trading at $6.47 by 2026.
Flow Price Prediction 2027
Naturally, traders expect a bullish market sentiment after the crypto industry was affected negatively by the bears’ claw. Moreover, the build-up to the next Bitcoin halving in 2028 could evoke excitement in traders. As such we could expect FLOW to trade at around $8.61 by the end of 2027.
Flow Price Prediction 2028
As the crypto community’s hope will be re-ignited looking forward to Bitcoin halving like many altcoins, FLOW will continue to form new higher highs and is expected to move in an upward trajectory. Hence, FLOW would be trading at $10 after experiencing a massive surge by the end of 2028.
Flow Price Prediction 2029
2029 is expected to be another bull run due to the aftermath of the BTC halving. However, traders speculate that the crypto market would gradually become stable by this year. In tandem with the stable market sentiment and the slight price surge expected after the aftermath, FLOW could be trading at $10.67 by the end of 2029.
Flow Price Prediction 2030
After witnessing a bullish run in the market, FLOW and many altcoins would show signs of consolidation and might trade sideways and move downwards for some time while experiencing minor spikes. Therefore, by the end of 2030, FLOW could be trading at $11.33.
Flow Price Prediction 2040
The long-term forecast for FLOW indicates that this altcoin could reach a new all-time high(ATH). This would be one of the key moments as HODLERS may expect to sell some of their tokens at the ATH point.
However, FLOW may face a slight fall before starting its upward journey once again. It is expected that the average price of FLOW could reach $28 by 2040.
Flow Price Prediction 2050
The community believes that there will be widespread adoption of cryptocurrencies, which could maintain gradual bullish gains. By the end of 2050, if the bullish momentum is maintained, DOT could surpass the resistance level of $38.
Conclusion
As said above, the price of FLOW may even reach above $3.087 if investors have decided that the cryptocurrency is a good investment, along with mainstream cryptocurrencies.
FAQ
FLOW is the native token of the Flow blockchain.
Like other cryptocurrencies, Flow (FLOW) can be traded in cryptocurrency exchanges like Binance, Kraken, Kucoin, Gate.io, Bitfinex, and others.
Flow has a low possibility of surpassing its present all-time high (ATH) price of $46.16 in 2022.
It was launched in 2020.
Flow (FLOW) price is expected to reach $25 by 2023.
Flow is expected to reach $5.26 by 2024.
Flow is expected to reach $8.19 by 2025.
Flow is expected to reach $6.47 by 2026.
Flow is expected to reach $8.61 by 2027.
Flow is expected to reach $10.00 by 2028.
Flow is expected to reach $10.67 by 2029.
Flow is expected to reach $11.33 by 2030.
Flow is expected to reach $28 by 2040.
Flow is expected to reach $38 by 2050.
Disclaimer: The views and opinions, as well as all the information shared in this price prediction, are published in good faith. Readers must do their own research and due diligence. Any action taken by the reader is strictly at their own risk. Coin Edition and its affiliates will not be held liable for any direct or indirect damage or loss.
More Crypto Price Predictions:
- VeChain (VET) Price Prediction 2023-2030
- Monero (XMR) Price Prediction 2023-2030
- Filecoin (FIL) Price Prediction 2023-2030
- Polygon (MATIC) Price Prediction 2023-2030
Disclaimer: The information presented in this article is for informational and educational purposes only. The article does not constitute financial advice or advice of any kind. Coin Edition is not responsible for any losses incurred as a result of the utilization of content, products, or services mentioned. Readers are advised to exercise caution before taking any action related to the company.


 price prediction. Flow could be a good investment in 2023. Find out more about Flow (FLOW) on CE.)