 Price Prediction for June 30, 2025: Can Bulls Protect the $0.14 Support?")
Hedera (HBAR) is hovering around $0.14859 after a weak but steady rebound from the $0.133 low earlier this week. Despite persistent selling pressure throughout June, price action is stabilizing above a key accumulation zone, with short-term indicators pointing to a potential volatility breakout.
That said, the trend remains bearish on the macro structure unless bulls manage to reclaim the 0.154–0.158 resistance confluence.
What’s Happening With Hedera’s Price?
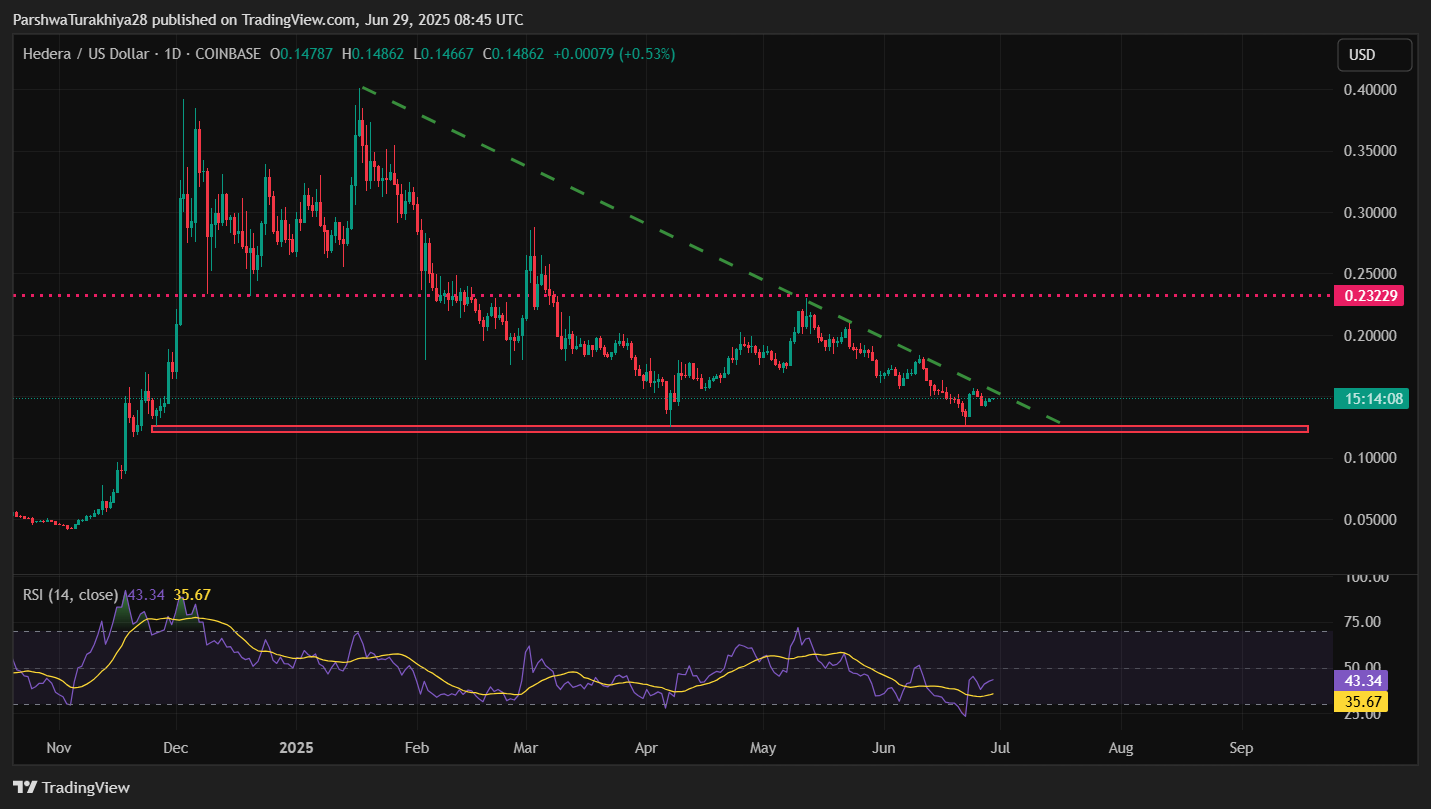
The broader Hedera price action remains locked inside a descending structure that has held since mid-April. The latest daily candle shows a slight upward bias, with price attempting to break out from a narrowing wedge.
Price is trading just above a major demand zone at $0.133–$0.141, which has historically served as a strong support base. The bounce from this level suggests buyers are actively defending the weekly 0.786 Fibonacci at $0.11847, though follow-through remains limited for now.
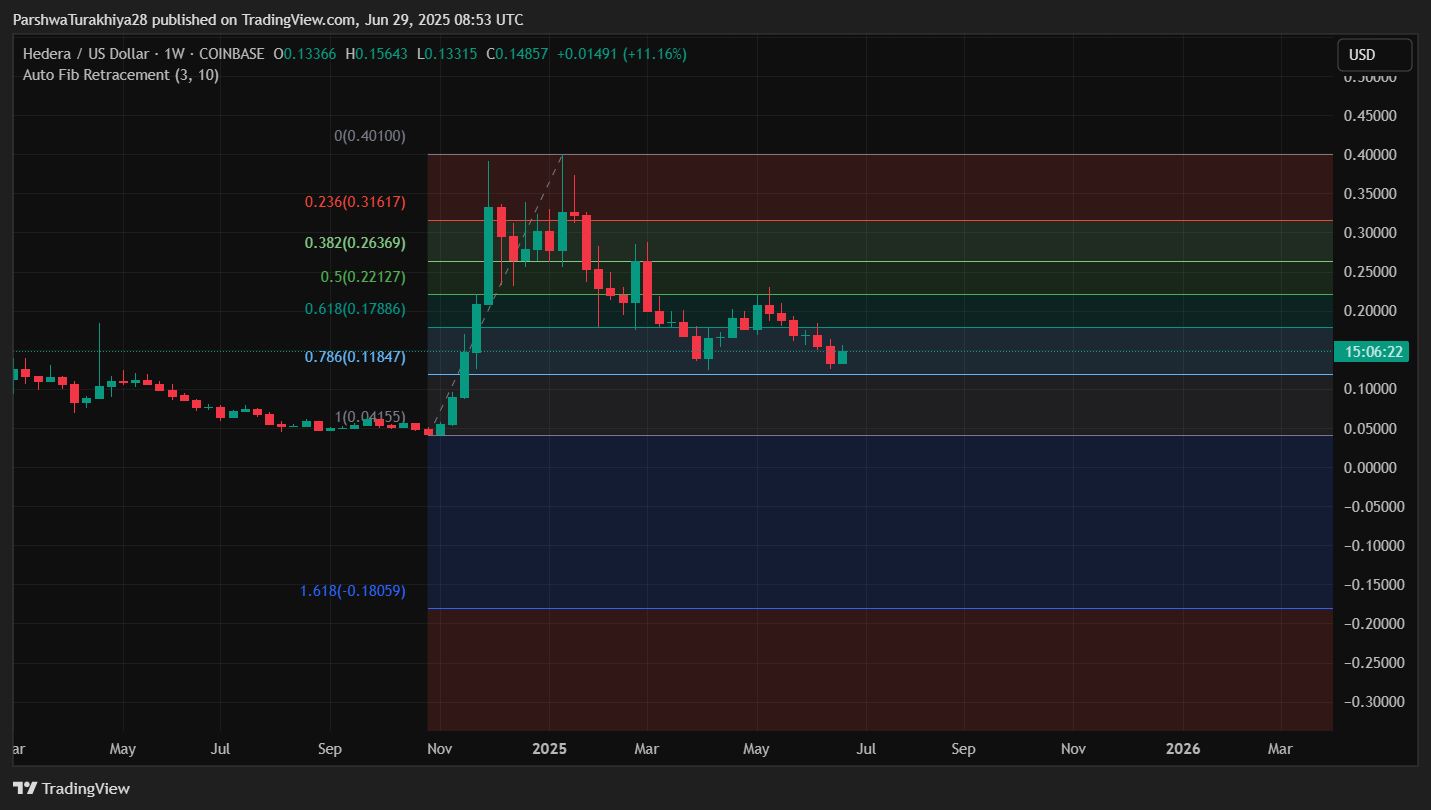
On the weekly chart, Hedera continues to respect the 0.618 Fib retracement at $0.178 and the 0.5 level near $0.221, both acting as major macro resistances. The longer-term outlook remains cautious unless those levels are challenged again.
Why Is the Hedera Price Going Up Today?
One reason behind the minor uptick in HBAR price today is localized buying at the intersection of horizontal support and downward trendline convergence.
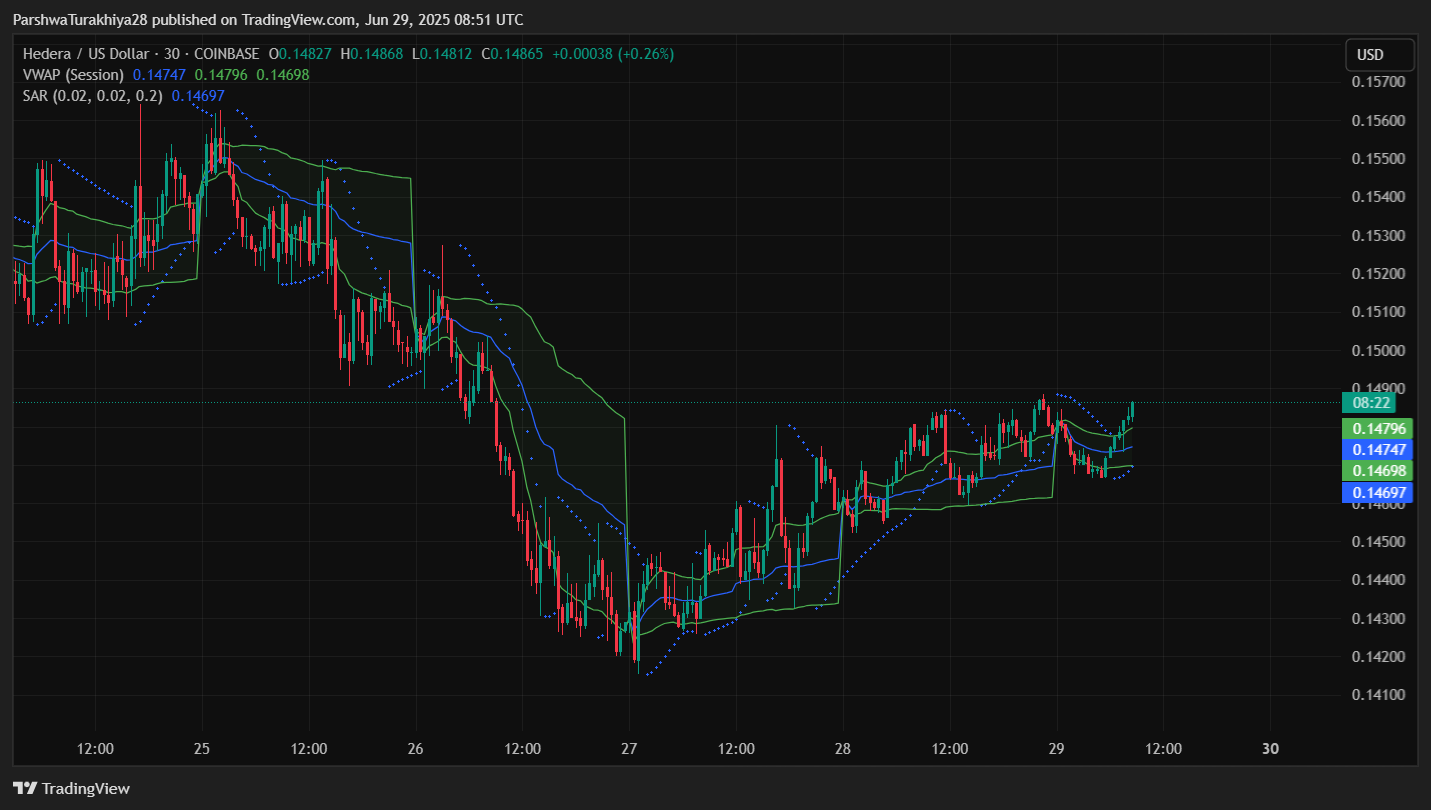
The 30-minute chart reveals that price is now consolidating above the session VWAP ($0.14796) and the Parabolic SAR has flipped below candles — a signal of potential short-term upward bias. Bollinger Bands are also tightening, suggesting a volatility event is due.
Meanwhile, the 4-hour RSI has risen to 43.34 from a previous low, with a bullish crossover forming above the 35 level. This indicates momentum is slowly recovering, even though it remains under the 50-neutral mark. The MACD on lower timeframes shows flattening histogram bars, further reinforcing this consolidation thesis.
Technical Signals and Key Indicators Point to Volatility Compression
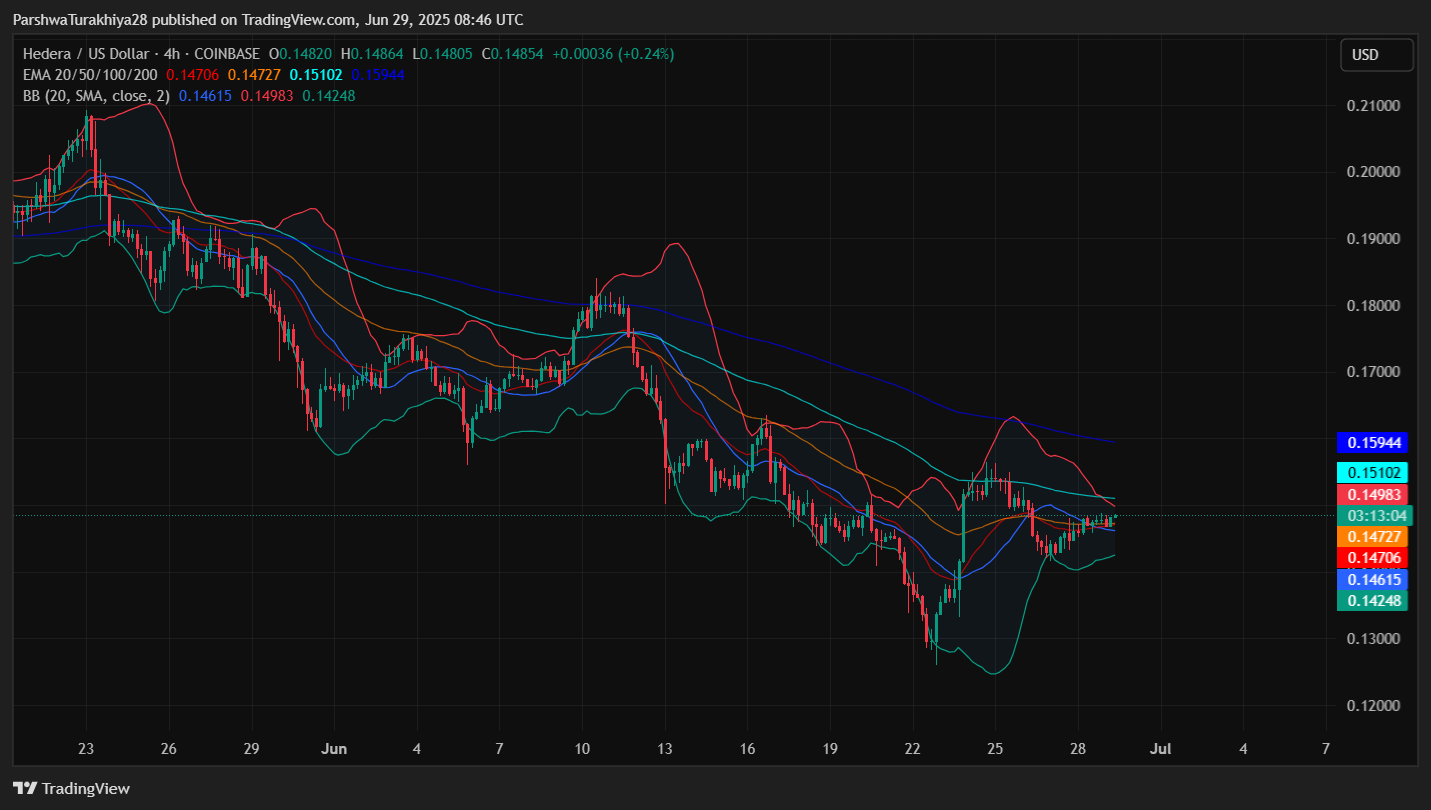
Looking at the 4-hour Bollinger Bands, price is currently squeezing between the middle band at $0.1498 and lower support band near $0.1424, with compression building across EMAs. The 20, 50, 100, and 200 EMAs are currently stacked bearishly between $0.1470–$0.1594, forming a congestion zone just above current levels.
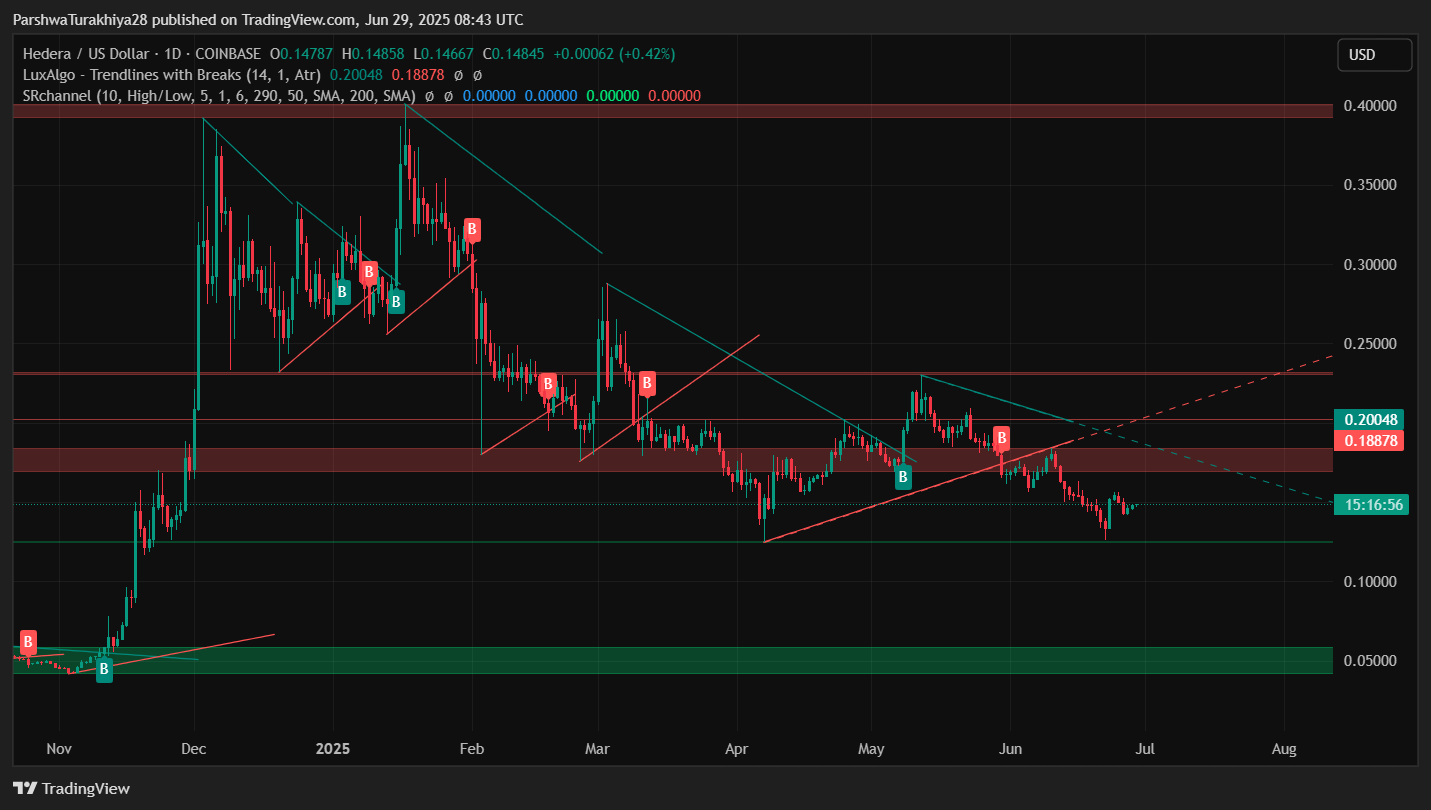
A rejection from this EMA cluster around $0.151–$0.154 could lead to another retest of $0.141. However, a confirmed breakout above $0.15425 — marked by both horizontal resistance and Fibonacci extension — could invite new long entries.
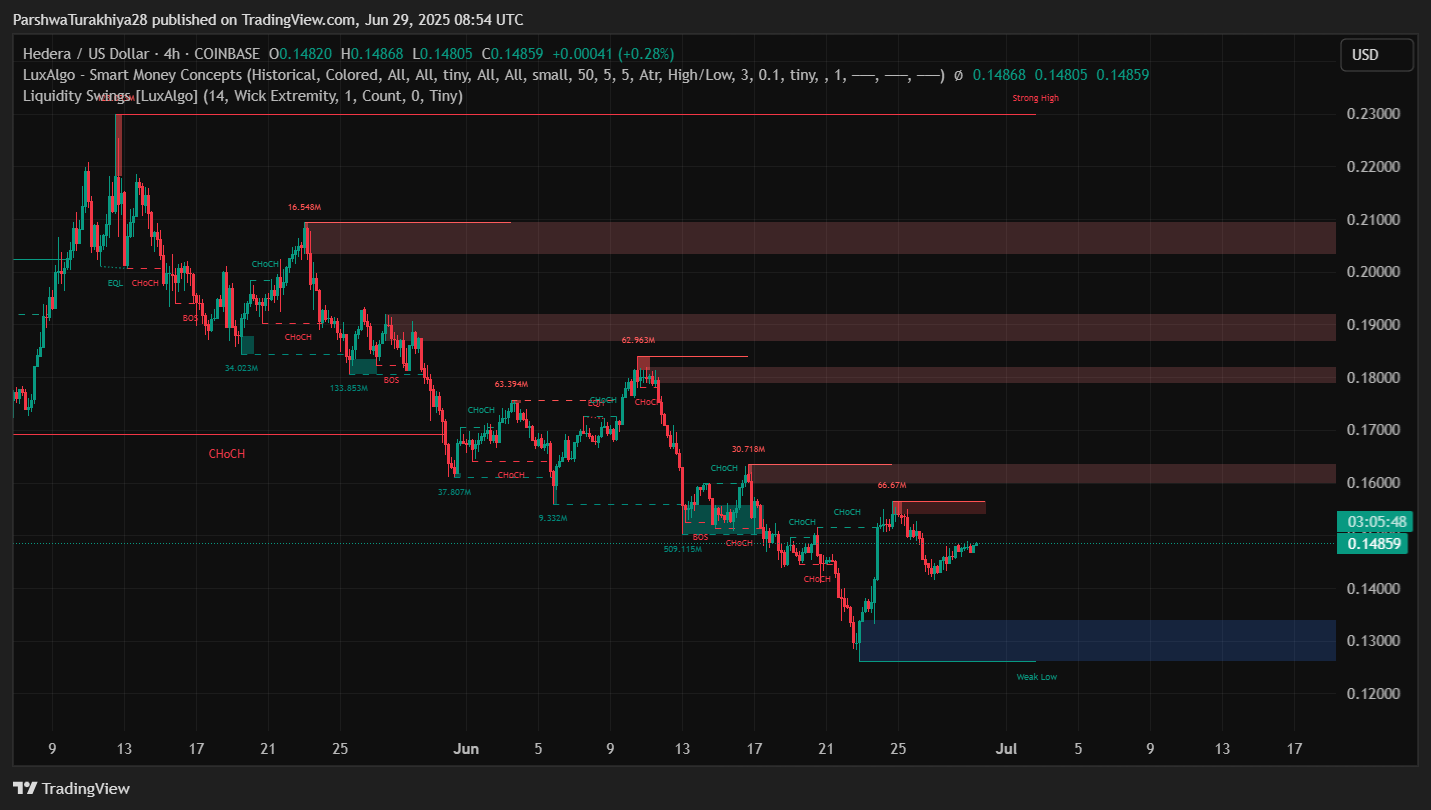
Smart Money Concept charts show CHoCH (Change of Character) events forming in the $0.152–$0.155 zone, highlighting an area of key liquidity and interest from both bulls and bears.
HBAR Price Prediction: Short-Term Outlook (24h)
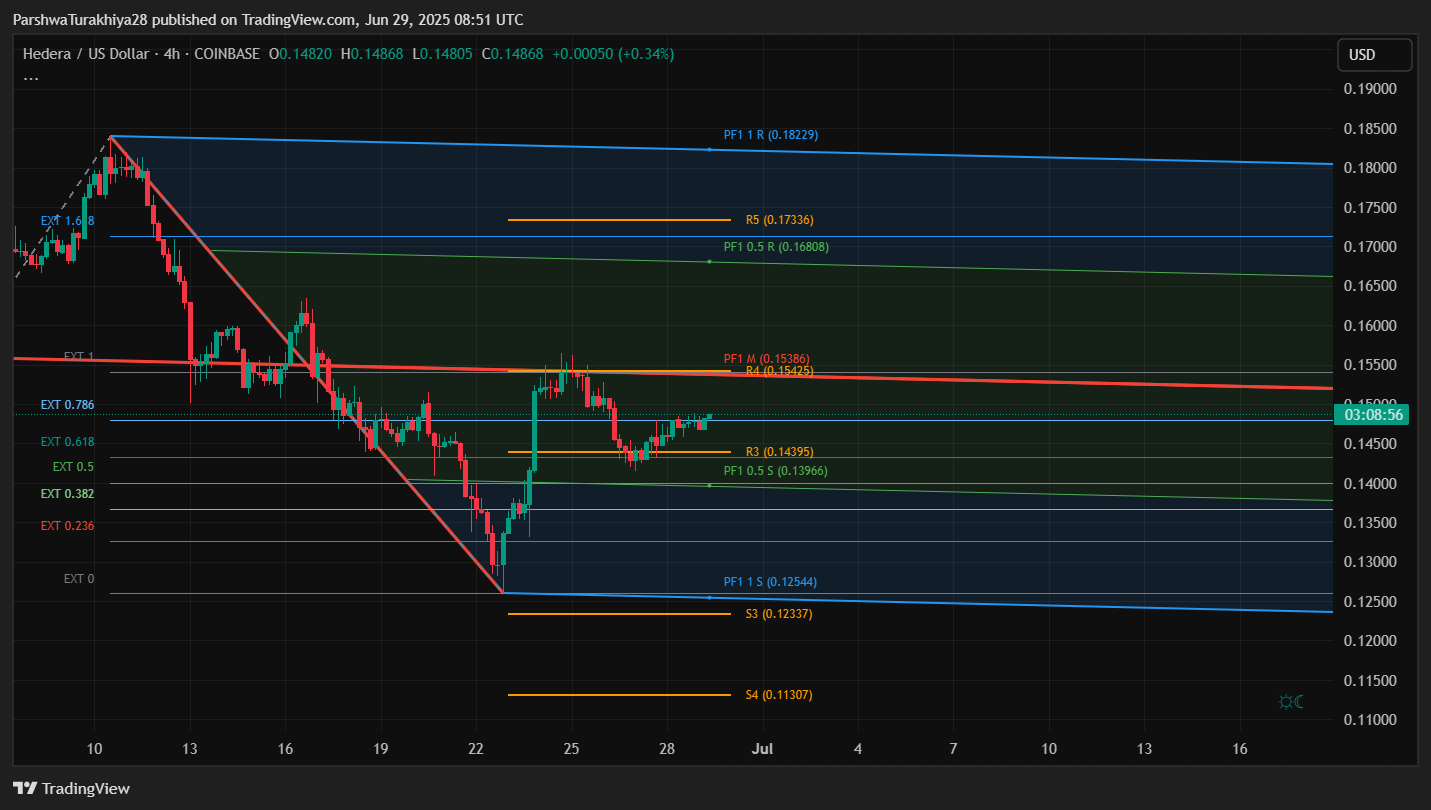
In the immediate term, HBAR bulls need to clear the $0.154–$0.156 resistance band, where multiple indicators including trendline resistance, EMAs, and Fibonacci pivot levels converge. A breakout above this could push price toward $0.1608, with extended upside potential to $0.1733.
On the downside, support remains firm at $0.1415. If this zone fails, price could cascade toward the weekly 0.786 Fibonacci at $0.11847, which is also a strong historical demand zone.
Given the tight Bollinger Band squeeze and growing RSI divergence, a breakout in either direction is likely within the next 24–48 hours.
Hedera Price Forecast Table: June 30, 2025
| Indicator/Zone | Level (USD) | Signal Description |
| HBAR price today | $0.14859 | Trading near VWAP, slight bullish bias |
| Resistance 1 | $0.15425 | Fibonacci + EMA cluster barrier |
| Resistance 2 | $0.16080 | SMC CHoCH zone, potential breakout target |
| Support 1 | $0.14154 | Key intraday support, green demand zone |
| Support 2 | $0.13300 | June low, structure base |
| RSI (4H) | 43.34 | Recovering from oversold, still below neutral |
| EMA 20/50/100/200 (4H) | 0.1470–0.1594 | Compression zone, trend decision area |
| Bollinger Band Width | Narrow | Volatility breakout likely |
| VWAP / SAR (30-min) | Flipped Bullish | Short-term upward structure |
| Weekly 0.786 Fib | $0.11847 | Long-term macro support |
Disclaimer: The information presented in this article is for informational and educational purposes only. The article does not constitute financial advice or advice of any kind. Coin Edition is not responsible for any losses incurred as a result of the utilization of content, products, or services mentioned. Readers are advised to exercise caution before taking any action related to the company.


 Price Prediction: Weak Momentum Signals Possible Drop to $62K")

 Price Prediction for April 2026: Will Chainlink Move Higher?")