
The Hyperliquid price today is trading near $33.85 after a volatile reversal from sub-$32 levels earlier in the week. Following a multi-day correction from the $46 peak, Hyperliquid price action has found temporary stability just above a key support cluster.
As traders assess why Hyperliquid price going down today, momentum remains divided, with bears still in control on higher timeframes while short-term charts hint at potential recovery.
What’s Happening With Hyperliquid’s Price?
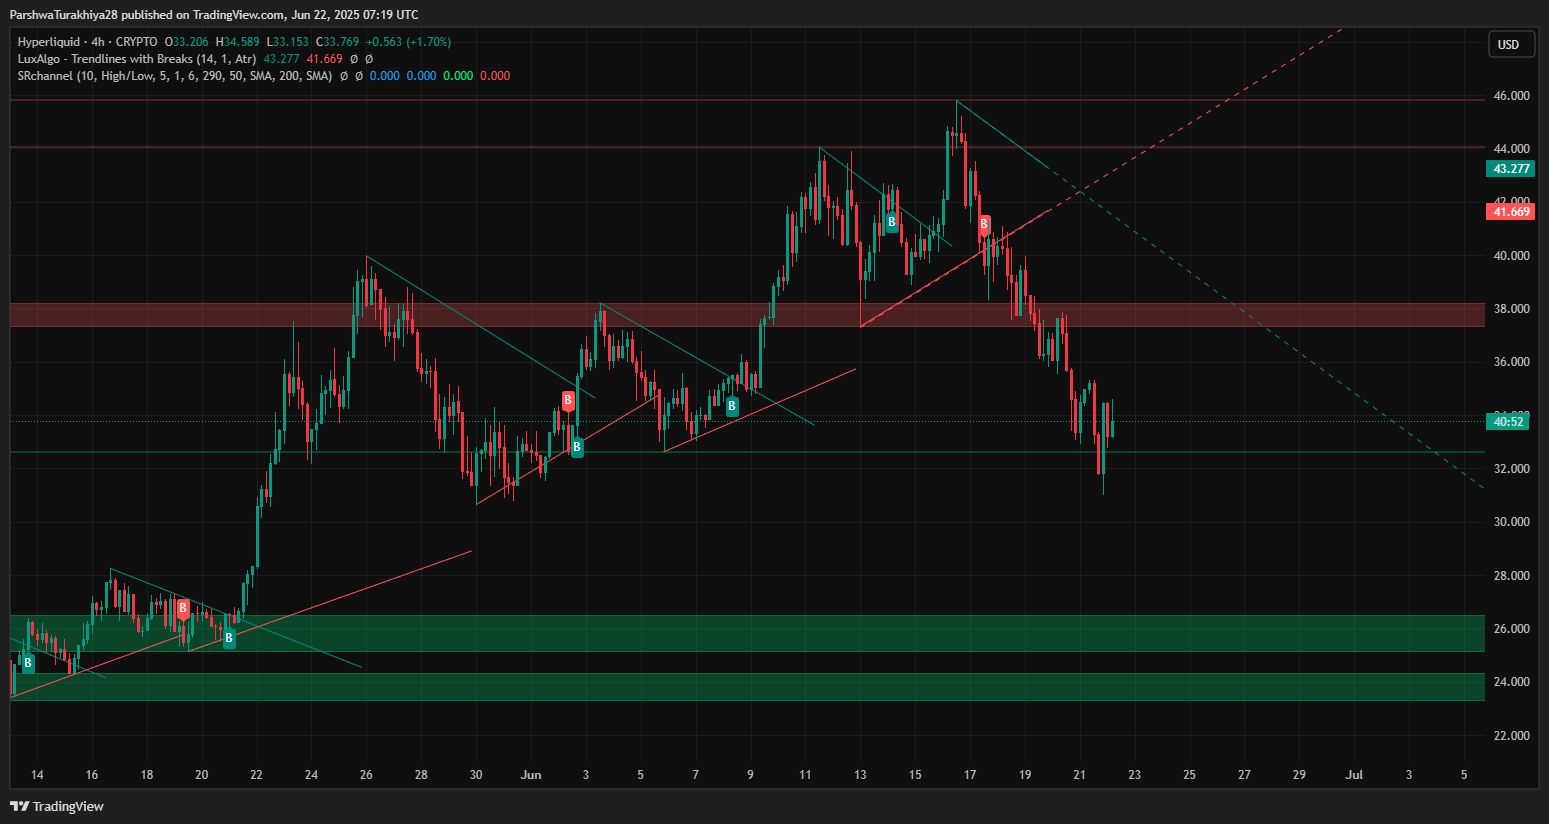
The Hyperliquid price has staged a modest rebound after hitting a low of $31.23 on June 21. This level aligns with a significant liquidity zone and marks the bottom of a previous bullish imbalance visible on the 4-hour structure. The bounce has carried price back toward the $34–$35 resistance zone, which now serves as the immediate hurdle for further upside.
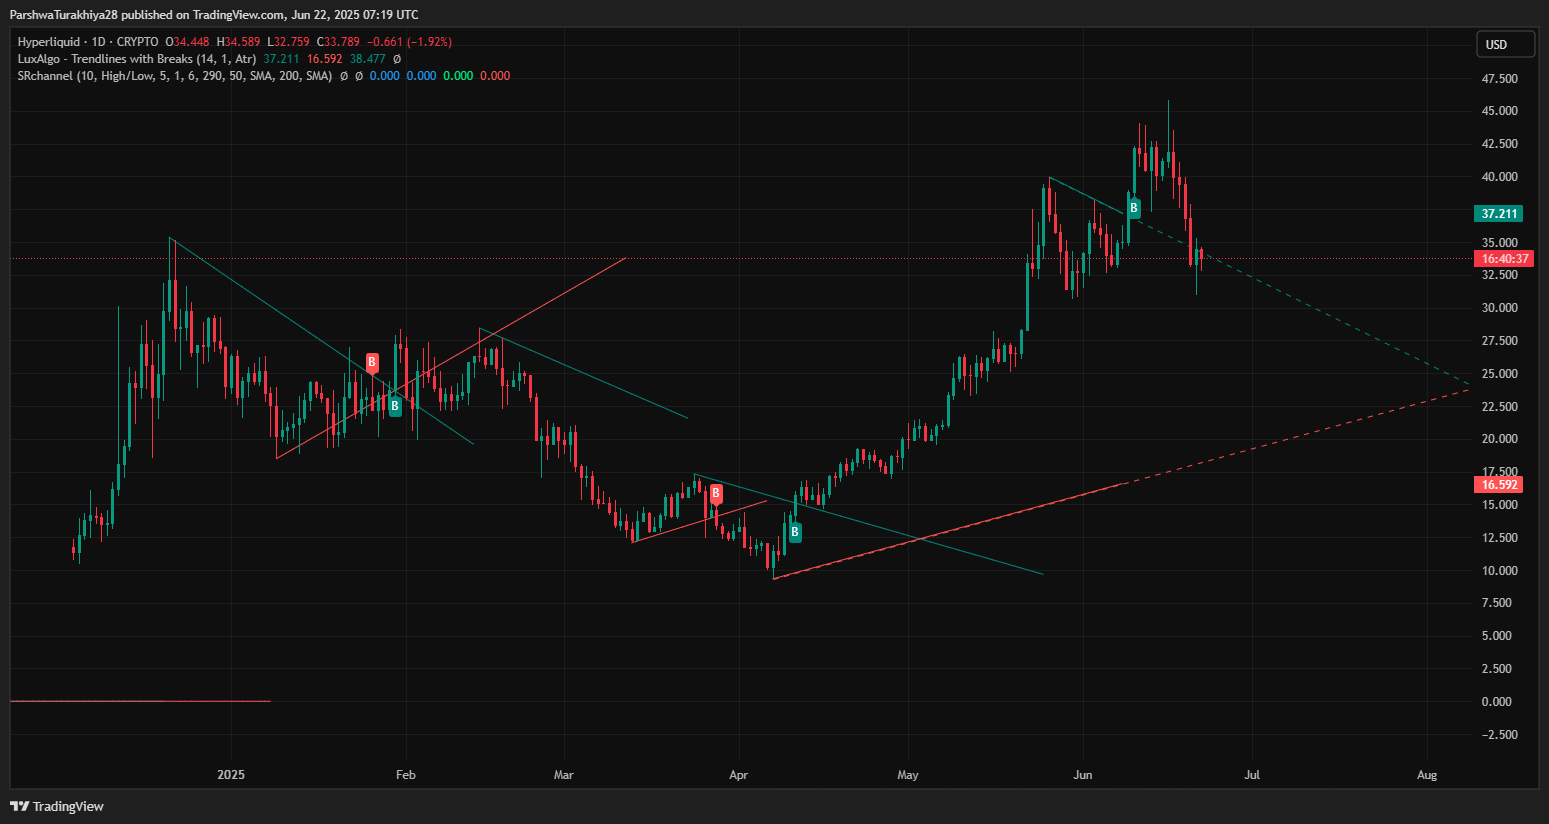
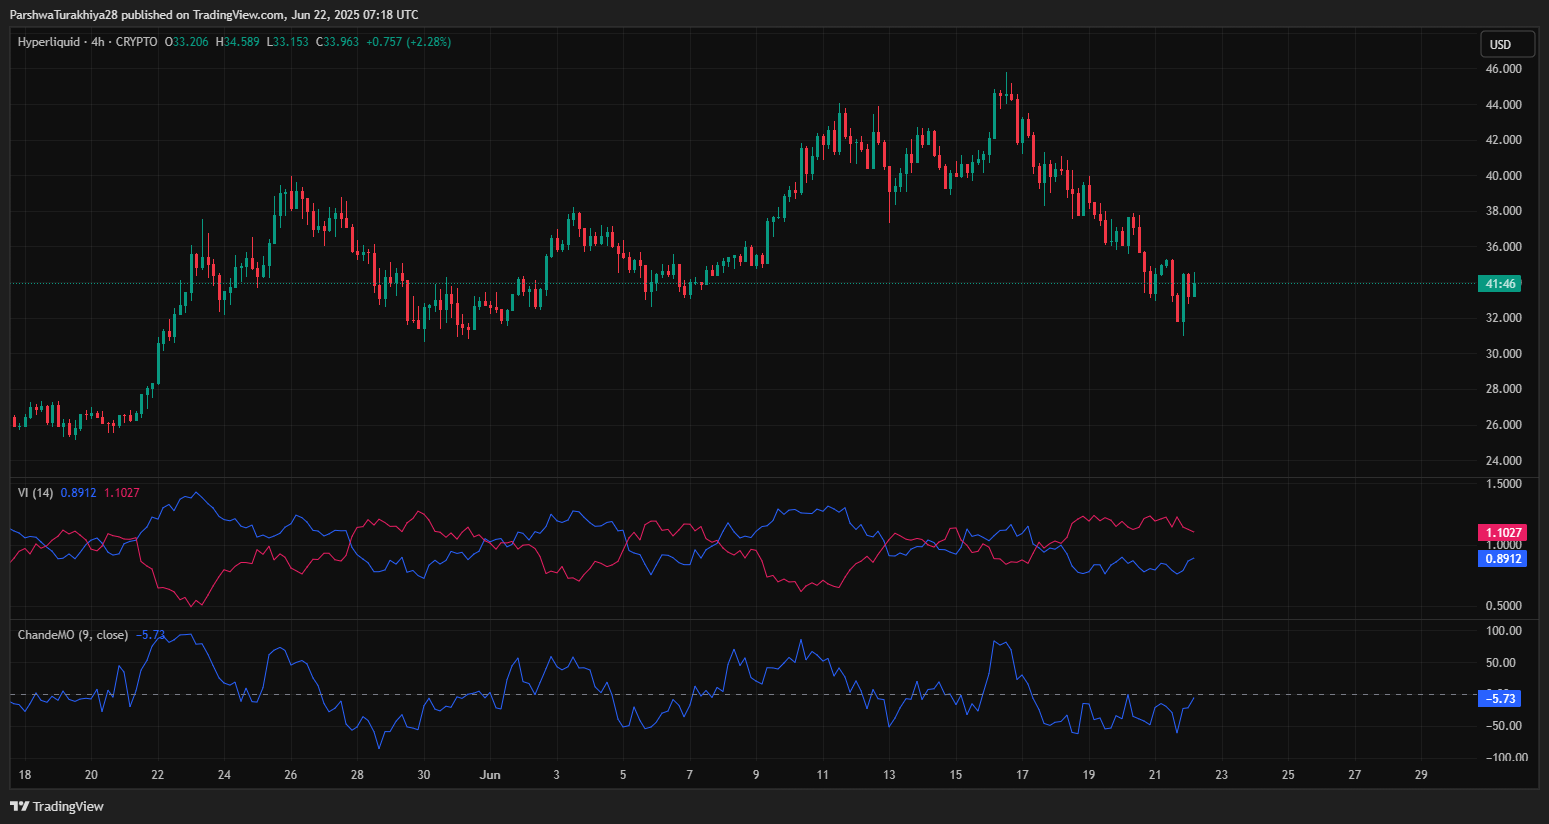
Looking at the broader chart, the daily candle structure shows a clear descending channel following a breakdown from the $45.90 swing high. Despite strong bullish activity throughout May, recent sell pressure has reversed a significant portion of those gains, with the Hyperliquid price update now reflecting a 25% drop from local highs.
Indicators Suggest Bearish Momentum Is Easing
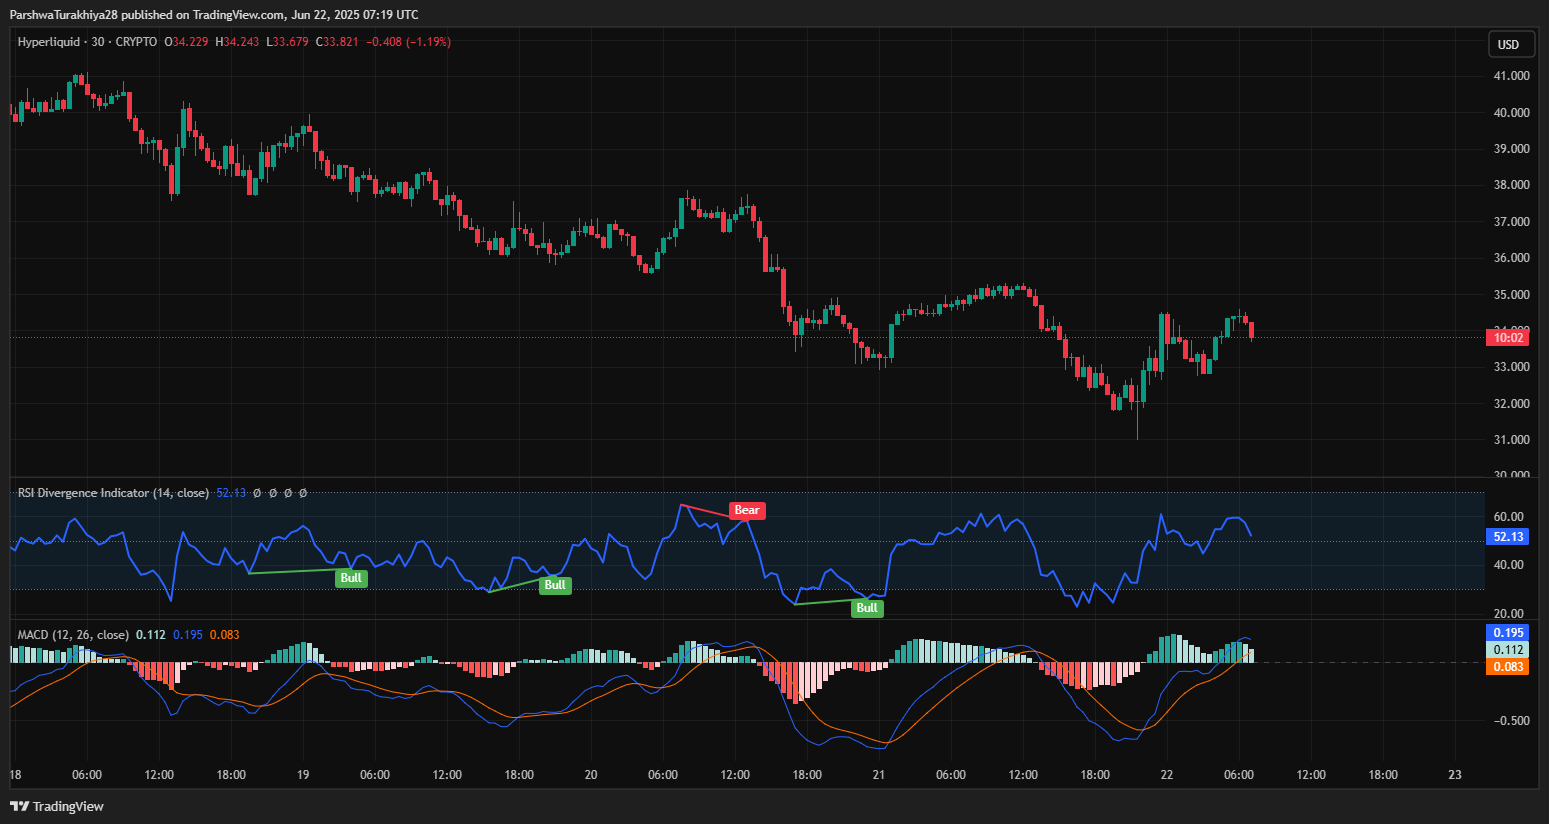
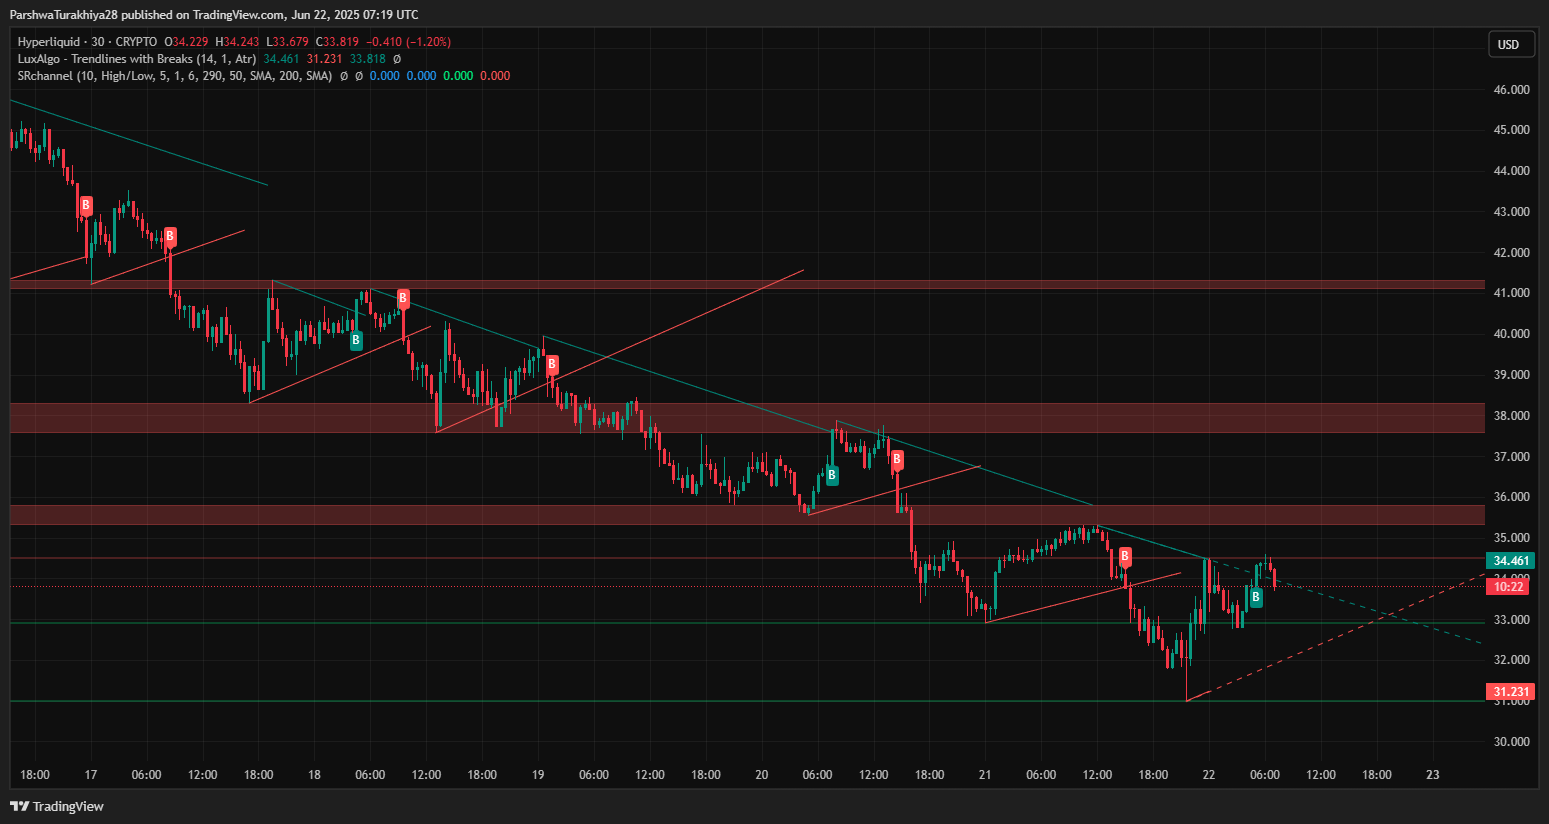
On the 30-minute chart, RSI has returned to a neutral zone at 52.13 after printing multiple bullish divergences between June 20 and 21. These setups correspond with the bottoming pattern near $31, which triggered the current bounce. MACD on the same timeframe has crossed into positive territory, with the histogram trending upward, indicating improving momentum in the short term.
On the 4-hour chart, however, momentum remains mixed. The Chande Momentum Oscillator is recovering but still prints a value near -5.73, suggesting a lag in broader trend reversal. The Supertrend indicator also remains red, with resistance overhead at $37.40, signaling that bullish conviction is still absent on a macro level.
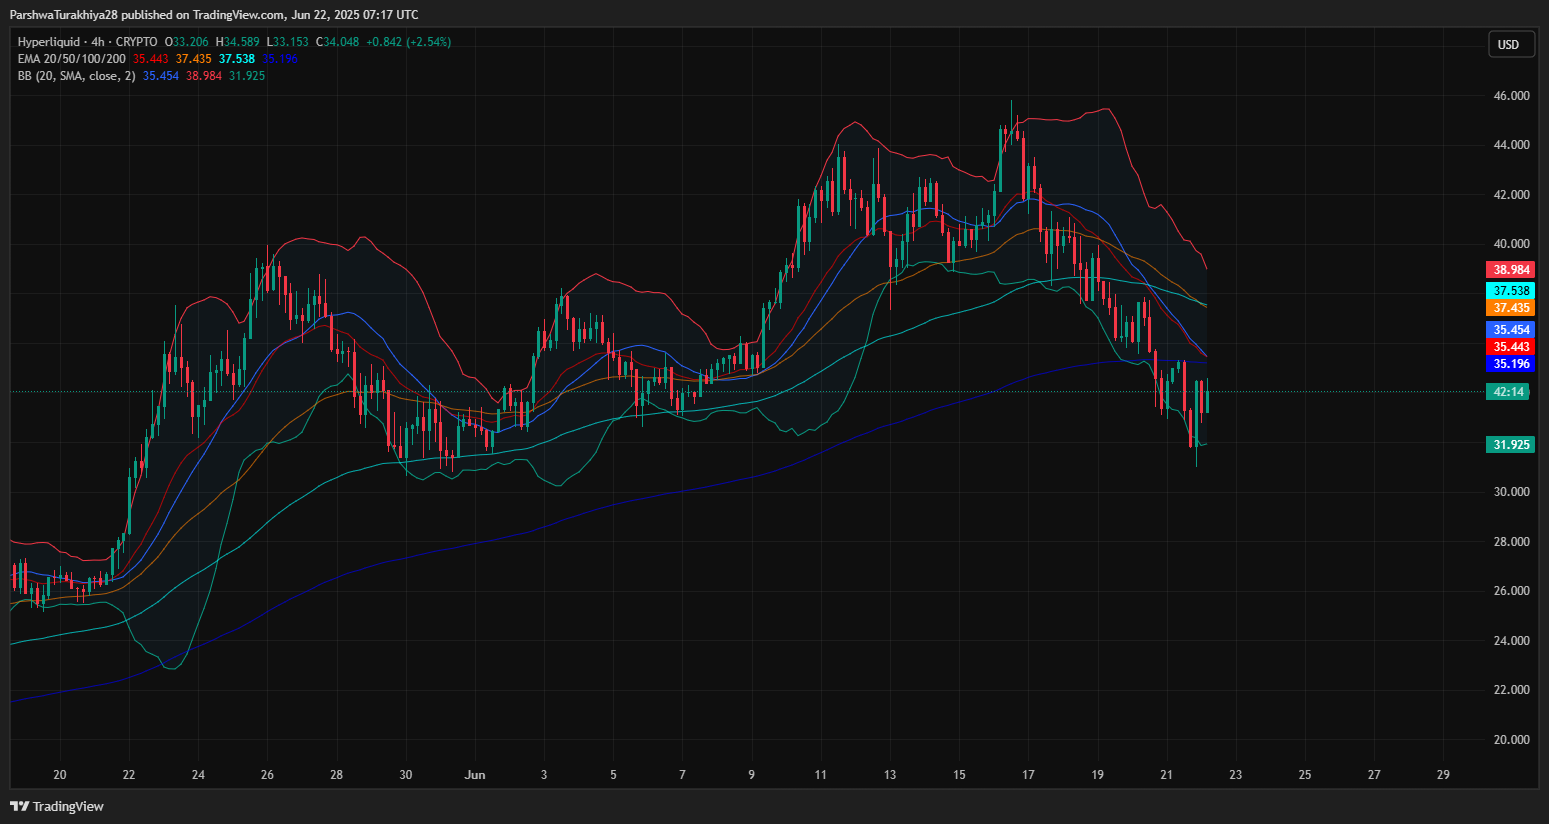
Bollinger Bands are beginning to widen again after compression during the consolidation phase, which could indicate incoming Hyperliquid price volatility. The mid-band at $35.45 and upper band near $38.98 will be key targets if the recovery sustains.
Structure Breakdown and Supply Zones in Focus
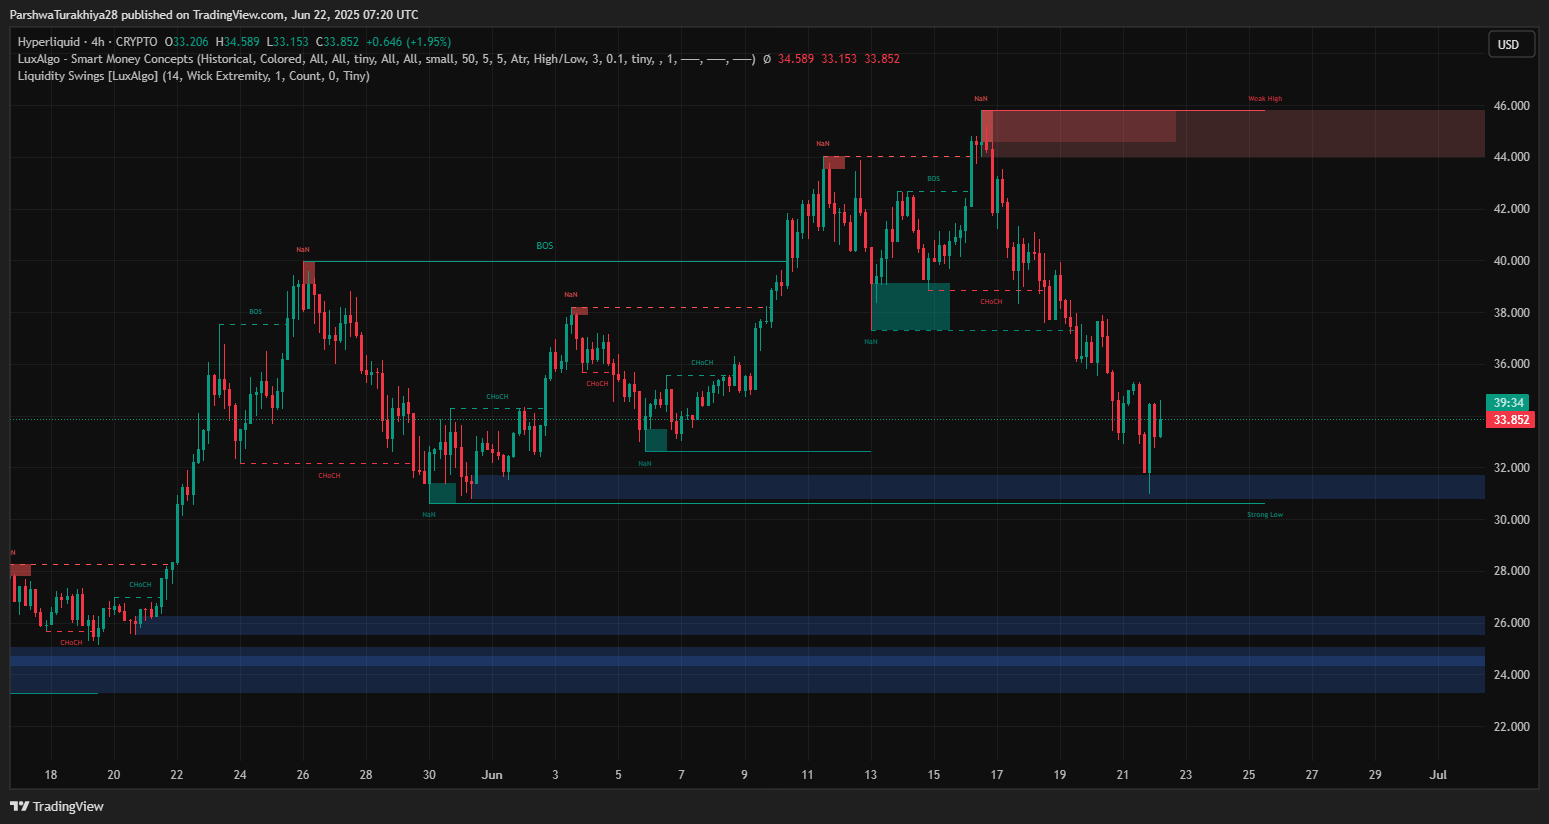
The most recent Hyperliquid price action shows a bounce from a clean demand zone around $30.80–$31.30. This area is supported by historical smart money concepts (CHoCH + BOS) and aligns with the lowest liquidity sweep on the 4H chart. On the upside, price now faces layered resistance between $34.50 and $35.80, which aligns with the lower boundary of the previous supply zone.
From a trend structure perspective, the diagonal resistance from the June 15 breakdown remains unbroken. A decisive breakout above $36 would be needed to shift short-term sentiment back in favor of bulls. Until then, price remains in a corrective phase within a larger bearish cycle.
Why Hyperliquid Price Going Down Today?

The decline in the Hyperliquid price today stems primarily from sustained profit-taking after the May–June surge. The sell-off intensified following a failure to hold above $44.00, which was previously the upper breakout zone from the ascending wedge. Multiple bearish rejections from $42.50–$43.20 fueled a sharp decline, exacerbated by weakening volume and negative divergence on RSI.
The DMI on the 4-hour chart shows strong -DI (41.40) dominance over +DI (10.47), further confirming active bearish strength.
Hyperliquid Price Forecast: Can Bulls Hold $33?
While price is showing signs of short-term recovery, it is too early to confirm a full reversal. The recovery from $31 is encouraging, especially given the cluster of bullish divergences and RSI lift. However, for upside momentum to be sustainable, bulls must reclaim and hold the $35.50 level — a zone backed by the 20/50 EMAs and mid-band resistance.
If price rejects from $35.50 again, downside risks remain toward $32.00 and the previous low at $30.80. Below that, the next support band lies between $28.00 and $26.20.
On the flip side, a clean breakout above $37.40–$38.00 would re-open the door to retesting the $40.00–$43.20 structure. In that case, renewed Hyperliquid price spikes could fuel momentum toward the $45–$47 range, provided broader market conditions are supportive.
Hyperliquid Technical Forecast Table: June 22
| Indicator/Zone | Level (USD) | Signal |
| Resistance 1 | 35.50 | EMA cluster and Bollinger mid-band |
| Resistance 2 | 37.40 | Supertrend ceiling |
| Support 1 | 32.00 | Rebound zone |
| Support 2 | 30.80 | Previous demand / liquidity sweep |
| RSI (30-min) | 52.13 | Neutral, slight bullish tilt |
| MACD (30-min) | 0.195 | Bullish crossover |
| Bollinger Bands (4H) | 31.92–38.98 | Widening, volatility return |
| DMI (+DI / -DI, 4H) | 10.47 / 41.40 | Bearish pressure still dominant |
| Vortex Indicator (4H) | VI+: 0.89 / VI–: 1.10 | Weak bullish response |
| Supertrend Resistance (4H) | 37.40 | Major trend barrier |
Disclaimer: The information presented in this article is for informational and educational purposes only. The article does not constitute financial advice or advice of any kind. Coin Edition is not responsible for any losses incurred as a result of the utilization of content, products, or services mentioned. Readers are advised to exercise caution before taking any action related to the company.


