
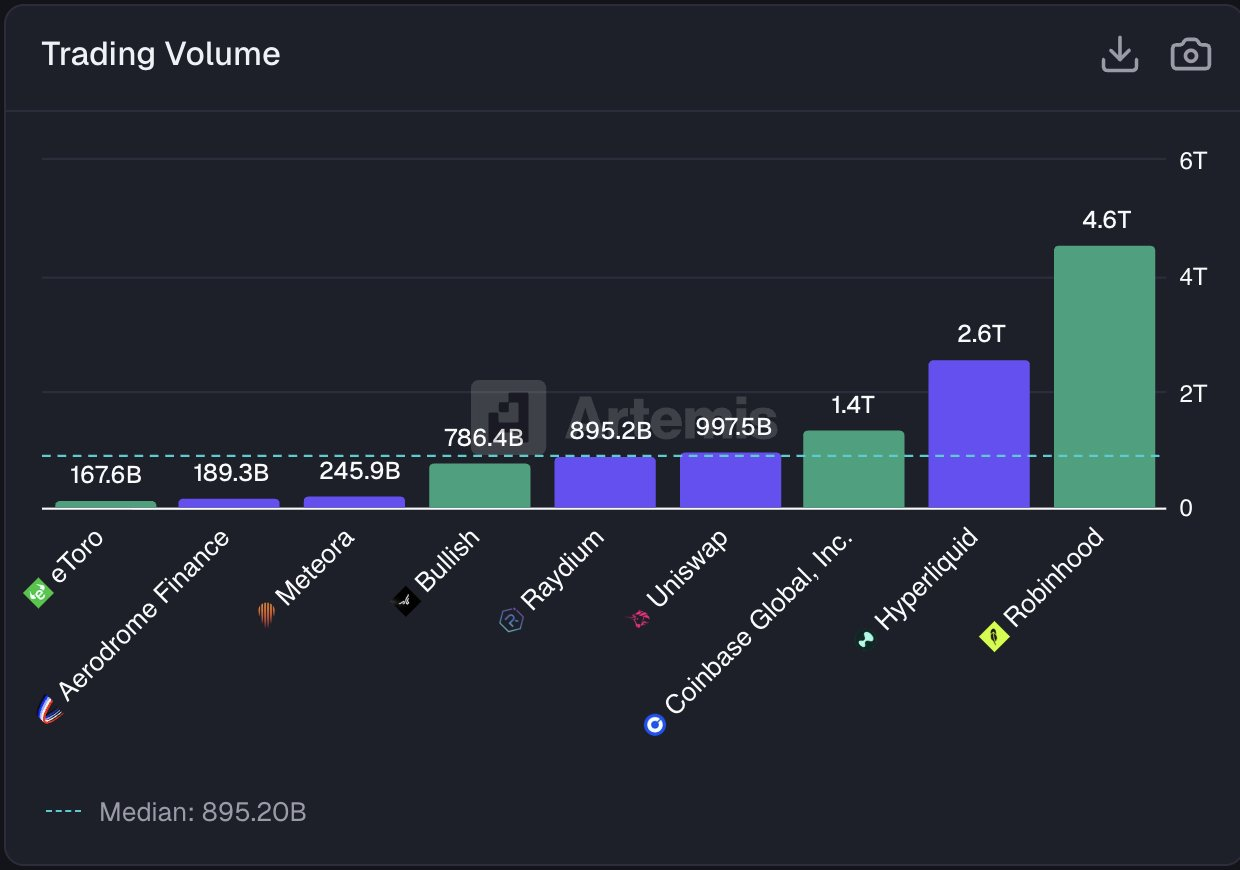
- Hyperliquid surpassed Coinbase, reaching $2.6 trillion in trading volume, nearly double the total.
- The platform launched in 2023 but is already rapidly gaining global exchange market share.
- CoinGlass data shows strong alignment between volume, open interest, and liquidation metrics.
On-chain derivatives platform Hyperliquid is gaining ground in the global crypto exchange market, with new data showing the young decentralized exchange has already surpassed Coinbase in total trading volume. According to Artemis analytics data, Coinbase has recorded roughly $1.4 trillion in volume, while Hyperliquid has reached approximately $2.6 trillion, nearly twice as much.
The milestone is striking given the difference in age between the two platforms. Coinbase, founded in 2012, has operated for more than a decade as a leading centralized exchange, while Hyperliquid launched only in 2023 and has scaled quickly within a few years.
Rapid Expansion Over the Past Year
The growth trend shows how quickly decentralized perpetual futures markets are evolving. In early 2025, decentralized perpetual exchanges collectively processed about $20 billion per week. By May 2025, Hyperliquid alone was handling around $80 billion weekly, and by early 2026, its cumulative trading volume had already reached levels significantly higher than many established competitors.
The Hyperliquid ecosystem token HYPE has gained about 31.7% year-to-date, while Coinbase-related equity performance has declined around 27%, creating a performance divergence of nearly 58.7% points over a short period.
Volume Metrics And Stronger Activity
Beyond headline volume figures, analysts are paying close attention to the internal consistency of trading metrics. Data tracked by CoinGlass comparing several decentralized perpetual venues shows Hyperliquid’s activity appears more closely aligned across key indicators such as trading volume, open interest (OI), and liquidations.
A recent 24-hour snapshot showed:
- Hyperliquid: $3.76 billion trading volume, $4.05 billion open interest, and $122.96 million liquidations
- Aster: $2.76 billion trading volume, $927 million open interest, and $7.2 million liquidations
- Lighter: $1.81 billion trading volume, $731 million open interest, and $3.34 million liquidations
Debate Over Liquidations And Leverage
Some critics argue that high liquidation numbers may simply reflect aggressive leverage and forced position closures rather than a healthier market structure. However, CoinGlass analysts said that Hyperliquid’s maximum leverage is about 40x, significantly lower than certain rival platforms that offer leverage as high as 200x, suggesting those venues may structurally encourage higher forced-exit activity despite reporting lower liquidation totals.
From a market-structure perspective, analysts say that the key factor is not liquidation size alone but whether volume, open interest, leverage limits, and liquidation flows move in a consistent pattern. Large daily volumes combined with unusually small liquidation levels can be a potential warning sign of incentive-driven trading churn rather than real demand.
Related: Hyperliquid Price Prediction: Can HYPE Reclaim $32.00 or Is Deeper Consolidation Ahead?
Disclaimer: The information presented in this article is for informational and educational purposes only. The article does not constitute financial advice or advice of any kind. Coin Edition is not responsible for any losses incurred as a result of the utilization of content, products, or services mentioned. Readers are advised to exercise caution before taking any action related to the company.


