
- CHZ price analysis suggests another bull run is on the way.
- The rise of CHZ is likely to be impacted by BTC rally after this year’s FOMC meeting
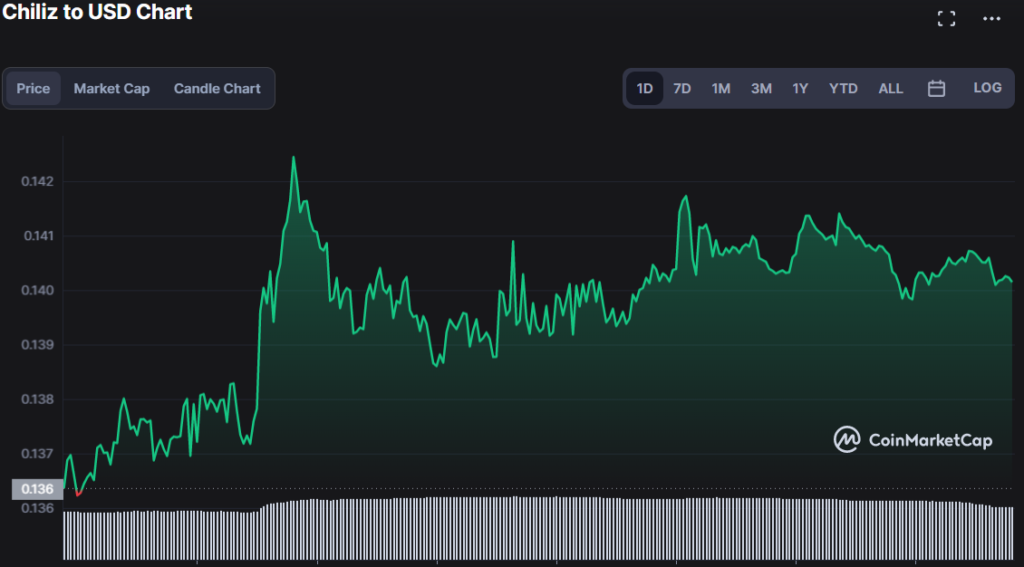
- Chiliz is facing resistance at $0.1429 and support at $0.1369.
The Chiliz (CHZ) price has been rising in the last 24 hours, indicating that buyers have taken control of the market. Since yesterday, the price of CHZ, which is currently trading at $0.1429, increased by 1.87%. In the CHZ market, the price of $0.1361 has emerged as a level of support for buyers, while $0.1429 has emerged as a level of resistance.
The fact that Bitcoin’s dramatic November reaction followed the Federal Open Market Committee (FOMC) statement further lends credence to this bullish forecast. Similarly, a surge in CHZ might be triggered by a spike in BTC after the FOMC statement.
Observed positive strength in the CHZ market is attributable to the fact that both trading volume and market capitalization have been on the rise, with the former increasing by 11.24 %, to $125,800,124, and the latter by 1.29 %, to $856,015,079.
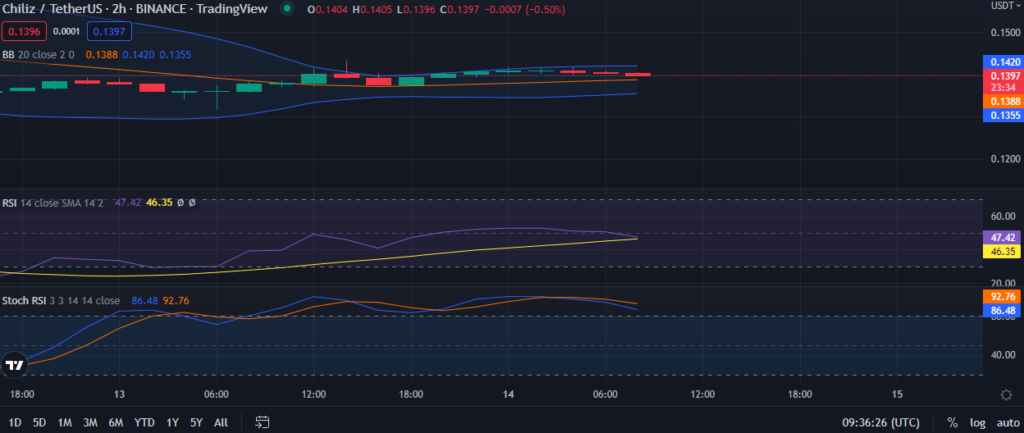
Bolstering this steady growth is the linear movement of the Bollinger Bands on the CHZ price chart, with the upper band reaching $0.1420 and the lower band touching $0.1355. This motion is indicative of a continuation of the positive trend. When the spot price moves up toward the top band, it usually means the bulls have the upper hand.
The Relative Strength Index (RSI) on the 2-hour chart of prices is heading south at 47.00, suggesting that the bull stranglehold on the CHZ price is weakening.
The Stoch RSI has been in the overbought zone in recent hours, with a value of 85.87 suggesting that the current trend is reaching its conclusion; however, this does not ensure that prices will bounce higher but rather serves as a warning to traders.
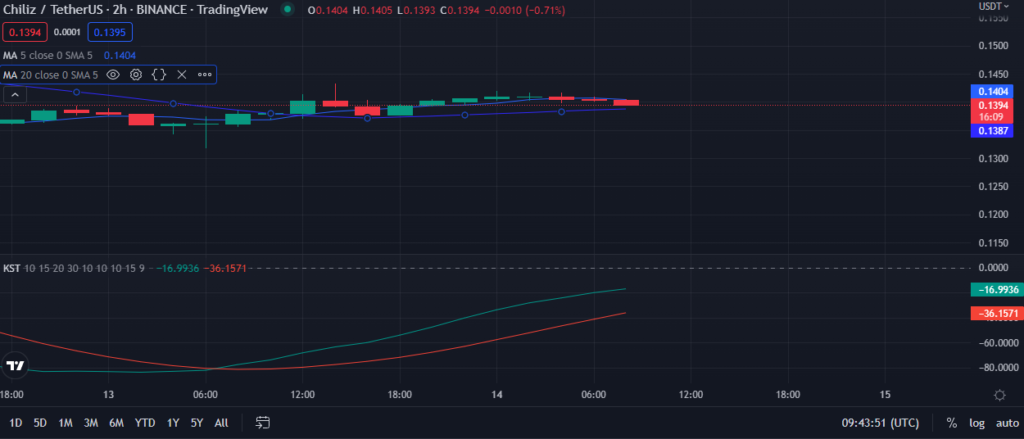
The Know Sure Thing (KST) level is -16.8698, but it is advancing. The fact that the KST line is in the negative zone and increasing suggests that bullish momentum is building.
A bullish crossing occurs when the long-term moving average falls below the short-term moving average. This is noticeable on CHZ charts when the 20-day moving average crosses below the 5-day moving average, which has values of $0.1387 and $0.1404, respectively.
The bulls have grabbed dominance of the market and successfully pulled up prices during the last 24 hours.
Disclaimer: The views and opinions, as well as all the information shared in this price prediction, are published in good faith. Readers must do their research and due diligence. Any action taken by the reader is strictly at their own risk. Coin Edition and its affiliates will not be held liable for any direct or indirect damage or loss.
Disclaimer: The information presented in this article is for informational and educational purposes only. The article does not constitute financial advice or advice of any kind. Coin Edition is not responsible for any losses incurred as a result of the utilization of content, products, or services mentioned. Readers are advised to exercise caution before taking any action related to the company.


