
- XRP bounces to $1.91 after $1.61 dip, faces key resistance near $2.00 / $2.14 EMA
- Large whale transfer (200M XRP to Binance) adds caution, potential volatility signal
- Analysts split: Ali Charts sees potential dip to $1.30, Dark Defender notes $1.88 support
XRP’s price action has been highly volatile this week, leaving traders analyzing technical signals and debating the altcoin’s next potential move after a sharp dip and partial recovery.
The coin dropped to a daily low of $1.61 on Tuesday during a wider crypto market downturn, causing concern among holders, according to CoinMarketCap data. However, XRP demonstrated resilience, bouncing back significantly to trade around $1.91 at press time – marking a solid 7% gain over the last 24 hours.
What Resistance Must XRP Break for a Rally?
Despite the recovery, XRP faces significant hurdles to regain clear bullish momentum. It needs to overcome the psychological $2 resistance level. More critically, analysts point to the 20-day Exponential Moving Average (EMA), currently situated near $2.14, as a key technical barrier.
A decisive breakout above $2.14, backed by substantial trading volume, could potentially ignite a rally towards the often-discussed $3 target.
Why Are Traders Still Cautious?
Market participants remain watchful, particularly following a large whale transaction detected by on-chain tracker Whale Alert. A known Ripple whale transferred 200 million XRP tokens, valued at over $355 million, to the Binance exchange.
Such large movements to exchanges can sometimes precede increased selling pressure or heightened volatility, prompting speculation about potential short-term price corrections.
Related: Don’t Ignore This XRP Signal: Strong XRP/ETH Ratio Defies Market Crash
What Are Analysts Predicting for XRP?
Current analyst outlooks on XRP are divided. Crypto analyst Ali Charts highlighted a potentially bearish scenario, noting a possible head-and-shoulders pattern forming on XRP’s chart. If confirmed, this technical formation could signal a decline towards the $1.30 level before any significant rebound.
Conversely, analyst Dark Defender offered a more stable perspective, emphasizing that key monthly support at $1.8815 is holding firm, suggesting XRP isn’t in immediate danger of collapse as long as that level is maintained.
What Do XRP’s Technical Indicators Suggest?
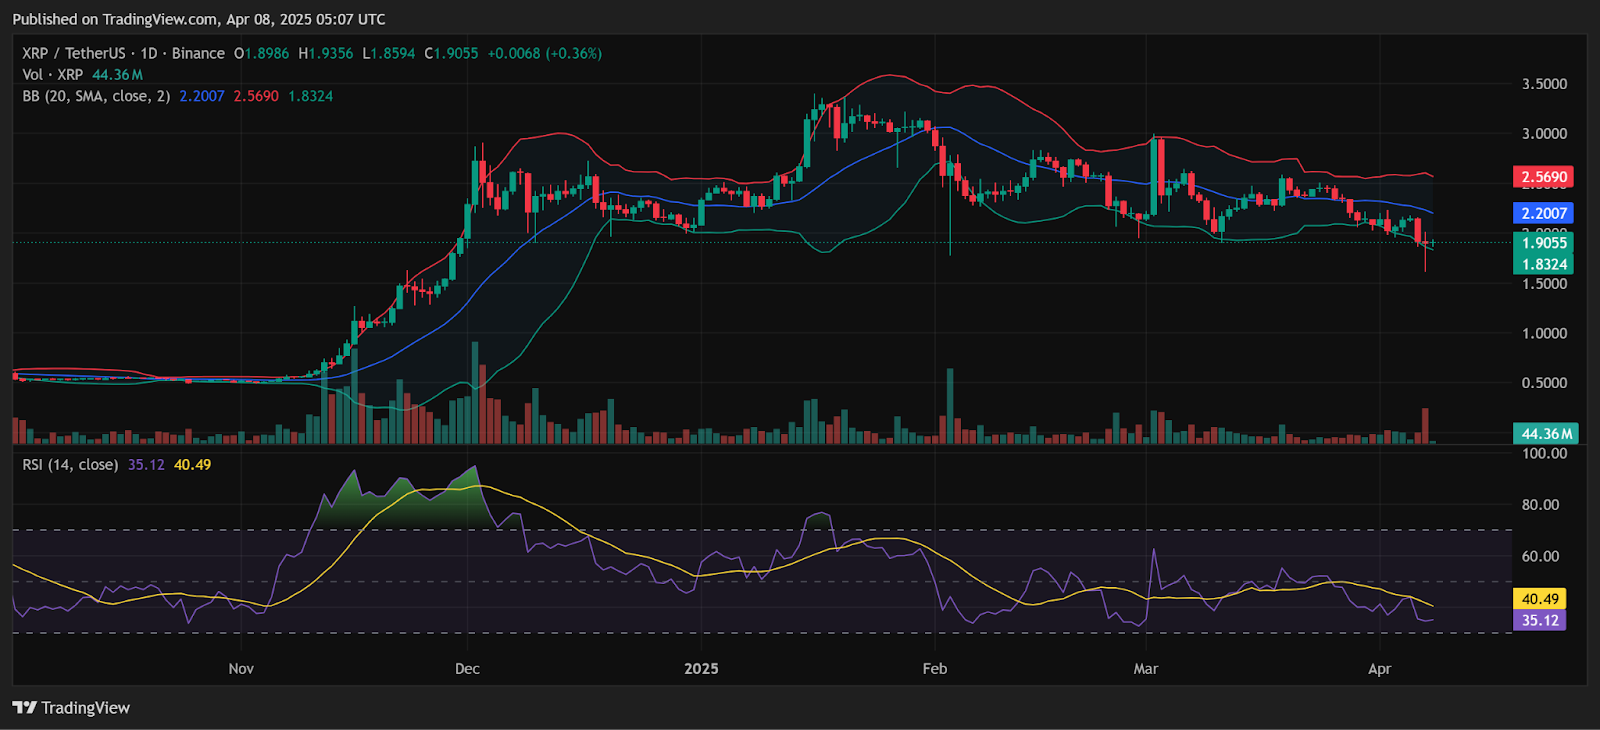
The daily chart provided by TradingView below shows that the Relative Strength Index (RSI) reads a value of 35.12, which means that the bears are overall in charge of the XRP price action. The gradient of the line suggests consolidation at current levels.
Related: Selling XRP Now? Top Trader Says History Shows This Might Be THE Setup
The XRP price action is currently situated at the lower end of the Bollinger Bands, after facing a bearish breakout in the past two days. Investors need to watch out if the support at $1.8 holds and whether XRP attempts to break out of the resistance levels at $2.2 and $2.5.
Disclaimer: The information presented in this article is for informational and educational purposes only. The article does not constitute financial advice or advice of any kind. Coin Edition is not responsible for any losses incurred as a result of the utilization of content, products, or services mentioned. Readers are advised to exercise caution before taking any action related to the company.
 Price Prediction: Can Bulls Sustain the $0.045 Push?")


