
- JTO soared 28.80% in the past 24 hours, claiming $3.41.
- The cryptocurrency shot up following Upbit’s JTO listing announcement.
- JTO also reclaimed the 20-day exponential moving average in the past 24 hours.
Jito (JTO), a major liquid staking project on Solana, just jumped 28.80% in the last 24 hours. It’s now trading at $3.41.
This rapid increase happened after South Korean exchange Upbit made an announcement. Upbit confirmed JTO will be listed for trading on their platform. Trading is scheduled to start February 21st at 14:30 KST.
Upbit Listing Ignites 872% Trading Volume Surge
This Upbit listing immediately caused Jito’s trading volume to surge. It has since exploded, rising 872% compared to the previous day; CoinMarketCap data verifies this.
Specifically, Upbit will offer JTO trading in the Korean Won (KRW) market. There will be some initial trading restrictions in place.
Related: Upbit Faces Sanctions in South Korea Over AML Shortcomings
Trading Restrictions Aim to Curb Volatility
Buy orders face restrictions for about five minutes after trading starts. Furthermore, all order types (except limit orders) are restricted for one hour after the launch.
For added volatility control, sell orders have a cap. This cap is set at a minimum of 10% below the previous day’s closing price. This measure intends to prevent wild price swings.
Jito: Solana’s Top Liquid Staking Protocol
Jito is Solana’s largest liquid staking protocol. DefiLlama data shows it holds a Total Value Locked (TVL) of $2.6 billion.
Looking at recent performance: In January, the platform also became a top crypto project by fees. TokenTerminal data reveals it generated $63 million in January, only behind Tether and Tron.
JTO Price Analysis: Bullish Trend Strong
Analyzing price, JTO’s 20-day Exponential Moving Average (EMA) is at $2.878. This is well below its current $3.41 price. This indicates a strong bullish trend. Looking ahead, the 20-day EMA might be retested as a support level soon.
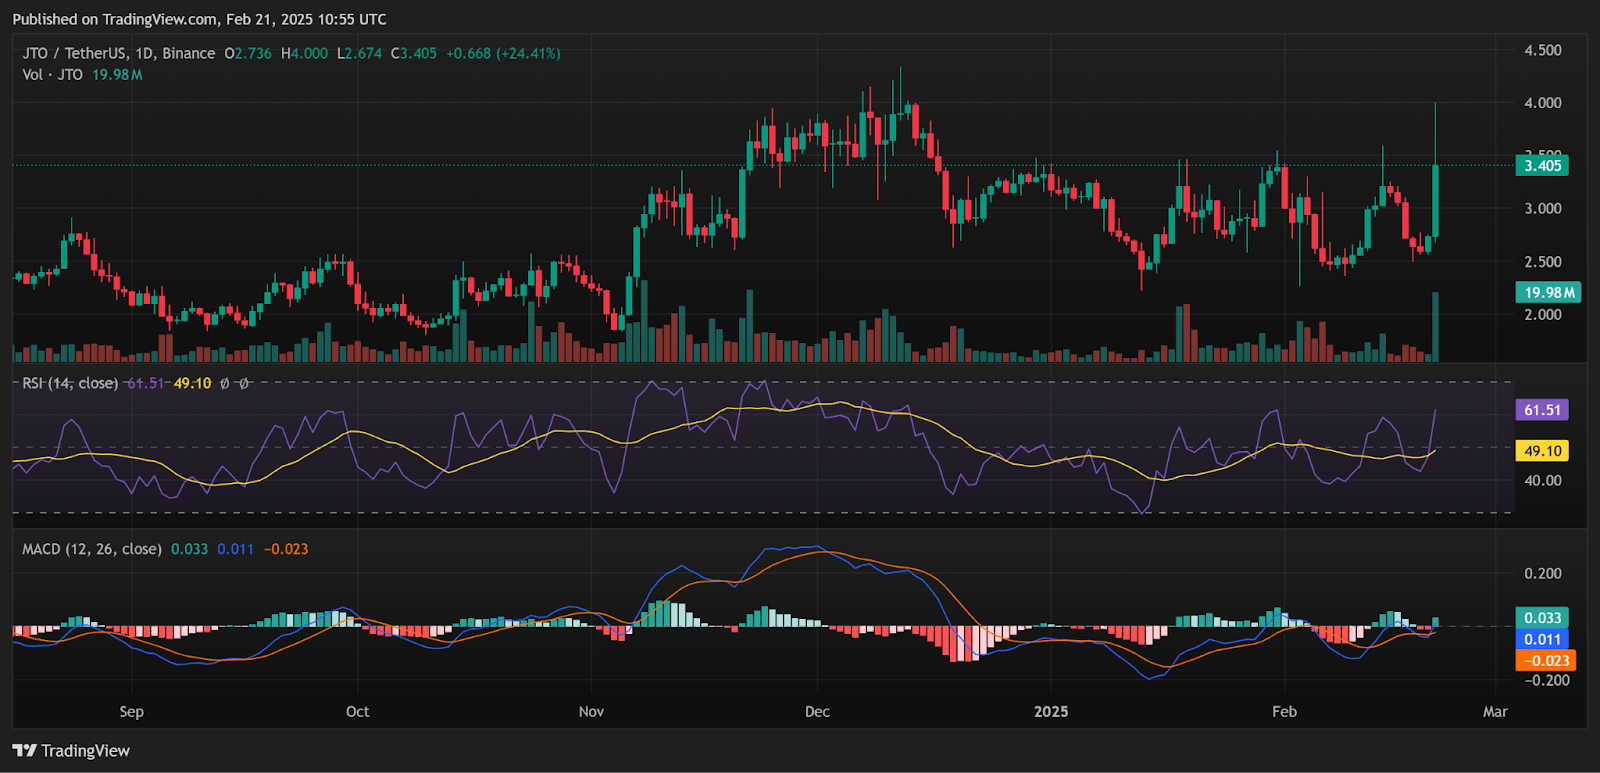
Meanwhile, the daily chart above shows that the Relative Strength Index (RSI) reads 61.51. This is above the neutral 50 level. This reading means buying momentum is strong, but not yet overbought (above 70). However, consider this: if the RSI keeps rising towards 70, a pullback could happen. Reason being, traders might start taking profits.
Related: TRUMP Price Prediction: Will Feb 13 Upbit Listing Lift $TRUMP Even Higher?
The Moving Average Convergence Divergence (MACD) indicator is also bullish. This is because the MACD line (blue) crossed above the signal line (orange). This crossover confirms a bullish shift. Visually, the histogram also shows green bars. Overall, these indicators suggest new all-time highs are possible this market cycle.
Disclaimer: The information presented in this article is for informational and educational purposes only. The article does not constitute financial advice or advice of any kind. Coin Edition is not responsible for any losses incurred as a result of the utilization of content, products, or services mentioned. Readers are advised to exercise caution before taking any action related to the company.


