 Price Prediction: Will Bulls Break Above 0.0635?")
- JST holds strong above key support, maintaining a clear bullish market structure
- Resistance near $0.0635 signals a pivotal breakout or short-term pullback zone
- Rising open interest and inflows confirm growing confidence and liquidity
JUST (JST) continues to show strength on the 4-hour chart, with price action holding firm above key support levels. The token trades near the $0.061–0.062 range, reflecting sustained bullish pressure. Market structure remains constructive, supported by higher highs and higher lows.
Besides, price continues to ride above all major moving averages, reinforcing trend continuation. However, momentum now approaches a critical resistance zone, where traders expect either a breakout or a short-term reset.
Bullish Structure Holds Firm Above Key Supports
JST maintains a clean uptrend, with buyers defending dips aggressively. The $0.0608–$0.0600 region acts as immediate support, aligning with recent consolidation.
Additionally, the $0.0582 level, marked by the 0.786 Fibonacci retracement, provides strong dynamic backing. This zone previously absorbed selling pressure and triggered a rebound.
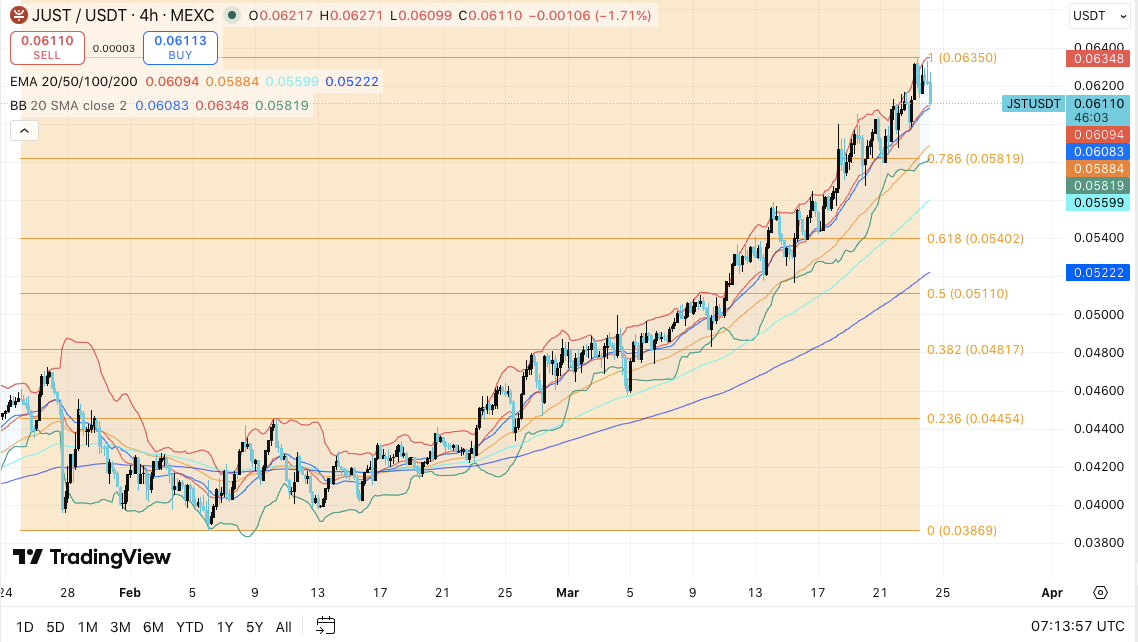
Moreover, deeper support at $0.0540 remains crucial for trend stability. A break below this level would weaken the current structure.
Consequently, traders continue to favor buying pullbacks rather than chasing price. The alignment of the 20, 50, 100, and 200 EMAs further confirms trend strength. Each average slopes upward, signaling sustained bullish momentum.
Resistance Test Signals Short-Term Decision Point
On the upside, JST faces immediate resistance at $0.0635, which has capped recent advances. This level acts as a short-term ceiling, where rejection remains possible. However, a confirmed breakout above this zone could open the path toward $0.065 and $0.068.
Significantly, Bollinger Bands show price hugging the upper band, indicating strong momentum. At the same time, this suggests short-term overextension. Hence, a temporary pullback toward $0.060 or even $0.058 would not disrupt the broader trend. Instead, it could reset indicators and attract fresh buyers.
Rising Open Interest Supports Market Confidence
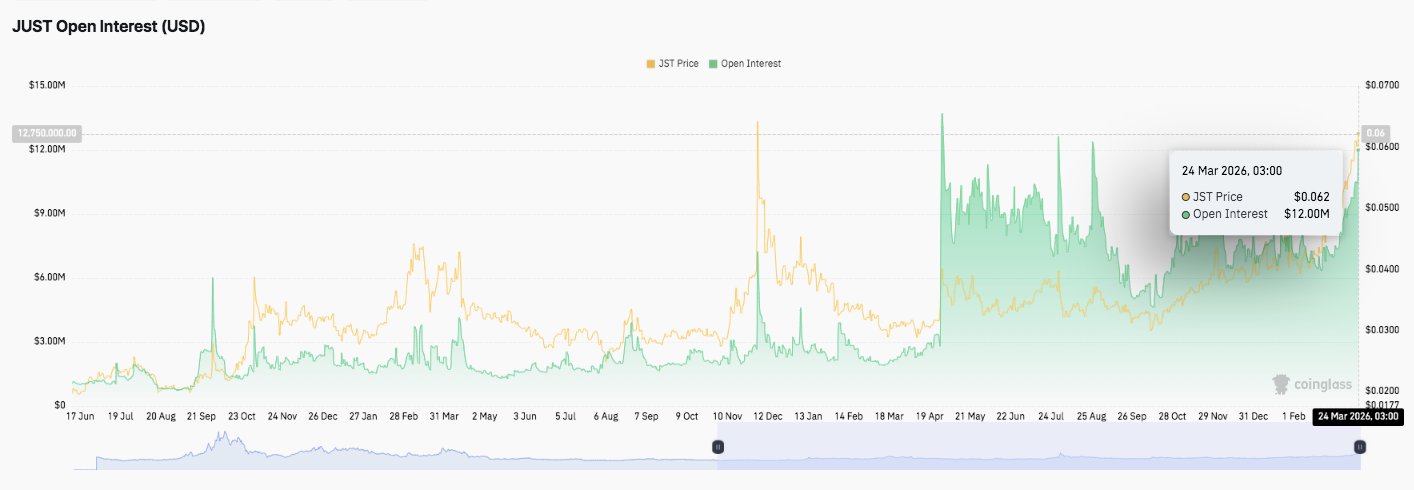
Derivatives data adds another layer of strength to the outlook. Open interest shows a steady long-term rise, with periodic spikes during high volatility phases. This trend reflects increasing trader participation and growing liquidity. Moreover, the latest data shows open interest stabilizing near peak levels while price trends higher.
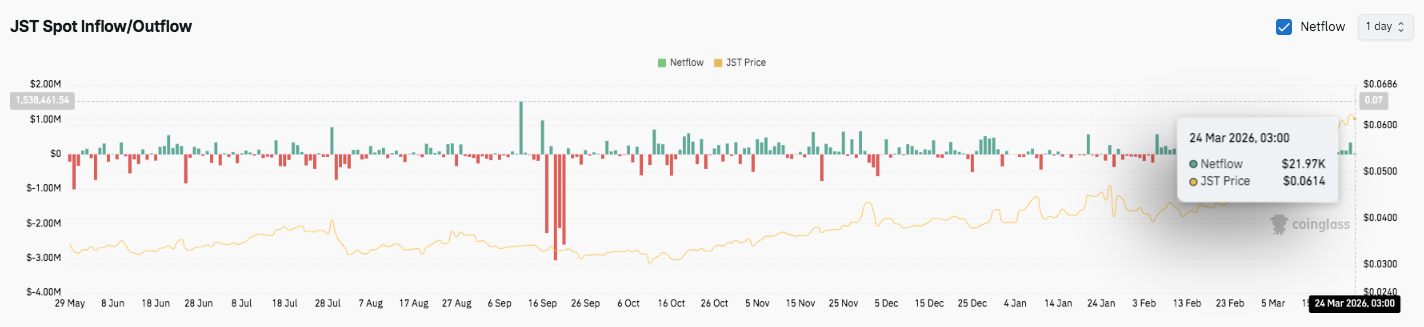
Spot flow activity also supports this narrative. Earlier periods showed mixed inflows and outflows, often leading to choppy price action. However, recent months indicate stronger inflows, suggesting gradual accumulation. Although occasional outflows persist, they fail to reverse the upward trend.
Related: Bittensor Price Prediction: TAO Reclaims $300 As “Bitcoin of AI” Narrative Builds
Technical Outlook for JUST (JST) Price
Key levels remain clearly defined as JST approaches a critical decision zone in the short term:
Upside levels: $0.0635, $0.0648, and $0.0660 serve as immediate resistance barriers. A breakout above this cluster could extend momentum toward $0.0685 and $0.0710.
Downside levels: $0.0608 trendline support, followed by $0.0582 and $0.0540 as deeper retracement zones. These levels align with key Fibonacci supports and previous demand areas.
Resistance ceiling: $0.0635 marks the current short-term high and acts as a critical level to flip for continued bullish momentum. A sustained move above this zone would confirm strength and attract further buying interest.
The technical structure shows JST trading within a bullish channel, supported by higher highs and higher lows. However, price now compresses near resistance, signaling a potential volatility expansion. This compression often precedes sharp moves in either direction.
Related: Strategy Buys 1,031 BTC, Launches $42B Capital Plan for Bitcoin
Will JUST Go Up?
JST’s price outlook depends on whether buyers defend the $0.0608–$0.0610 support zone. This area aligns with EMA confluence and recent consolidation. Holding this range would strengthen the bullish structure and build momentum for another push higher.
Moreover, increasing inflows and rising open interest support the bullish case. This suggests growing market participation and confidence among traders.
If bullish momentum strengthens, JST could break above $0.0635 and extend toward $0.0660 and beyond. Additionally, a confirmed breakout may trigger a continuation move toward $0.0685.
However, failure to hold $0.0608 could shift sentiment quickly. A breakdown may expose JST to $0.0582 and potentially $0.0540. Consequently, this would weaken the current bullish structure and signal a deeper correction phase.
Disclaimer: The information presented in this article is for informational and educational purposes only. The article does not constitute financial advice or advice of any kind. Coin Edition is not responsible for any losses incurred as a result of the utilization of content, products, or services mentioned. Readers are advised to exercise caution before taking any action related to the company.


 Price Prediction: Can Bulls Reclaim Momentum Above $0.000007?")
 Price Prediction: MemeCore Holds Ground as Bulls Eye Break Above $2")