- As BTC prices fall, bears have seized pricing power.
- Bulls must keep their grip on the resistance level to combat the present trend.
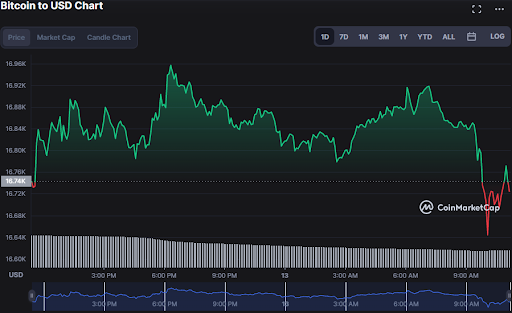
- BTC’s current value has dropped 1.85% to $16,536.85.
Bitcoin’s (BTC) price analysis depicts a negative turnaround as bears buck the rising trend, reducing the price by 1.85% to $16,536.85
Bitcoin’s market value and 24-hour trading volume declined by 0.32% and 48.57%, respectively, to $319,753,134,805 and $24,996,104,811.

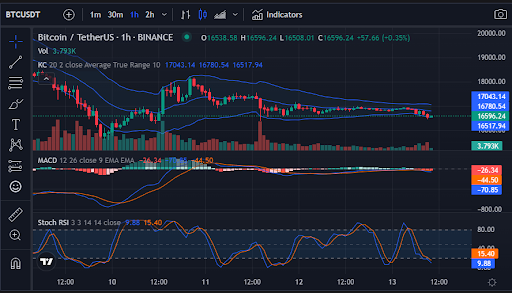
BTC/USD 24-hour price chart (Source: CoinMarketCap)On the 1-hour price chart, shrinking Keltner Channels exhibit low buying and selling pressure in the Bitcoin market. With the upper band hitting 17071.42 and the lower band striking 16527.85. Bitcoin price movement towards the lower Keltner band signals that this tendency may endure as bulls are satiated.
A bearish sequence is anticipated to persist as the signal line crosses over the blue MACD line, with a reading of -70.85 as seen on the BTC price chart. The shift in the negative territory lends credence to the belief that this trend will continue.
A bullish reversal is expected when the Stoch RSI reading falls below the oversold threshold of “20,” as seen on the BTC chart, where the Stoch RSI reading is 9.88 and the price is heading southward. However, this should serve as a cautionary tale to traders rather than a guarantee of a price reversal.

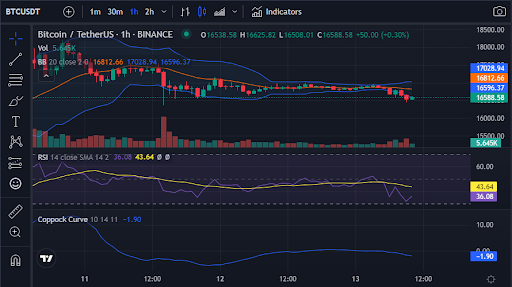
BTC/USD 1-hour price chart (Source: CoinMarketCap)On the 1-hour price chart, Bollinger Bands are narrowing, with the upper band touching 17027.58 and the lower band hitting 16598.42. BTC price is moving below the lower bar, supporting this negative trend.
The Coppock curve is trending in the negative region with a reading of -1.91, implying that grizzly grip will prevail if bulls do not intervene.
The Relative Strength Index (RSI) value of 35.84 is towards the oversold level, which alarms traders, but its upward trajectory sheds some light on BTC prices.

BTC/USD 1-hour price chart (Source: CoinMarketCap)To defy the bears and reverse the current trend, the bulls must retain the resistance level and propel prices higher.
Disclaimer: The views and opinions, as well as all the information shared in this price prediction, are published in good faith. Readers must do their research and due diligence. Any action taken by the reader is strictly at their own risk. Coin Edition and its affiliates will not be held liable for any direct or indirect damage or loss.
Disclaimer: The information presented in this article is for informational and educational purposes only. The article does not constitute financial advice or advice of any kind. Coin Edition is not responsible for any losses incurred as a result of the utilization of content, products, or services mentioned. Readers are advised to exercise caution before taking any action related to the company.


