- KSM shows bullish dominance, but decreasing trading volume raises caution.
- Keltner Channel bands suggest increasing market volatility, creating trading opportunities.
- RSI and ROC indicate a possible bearish reversal despite positive sentiment.
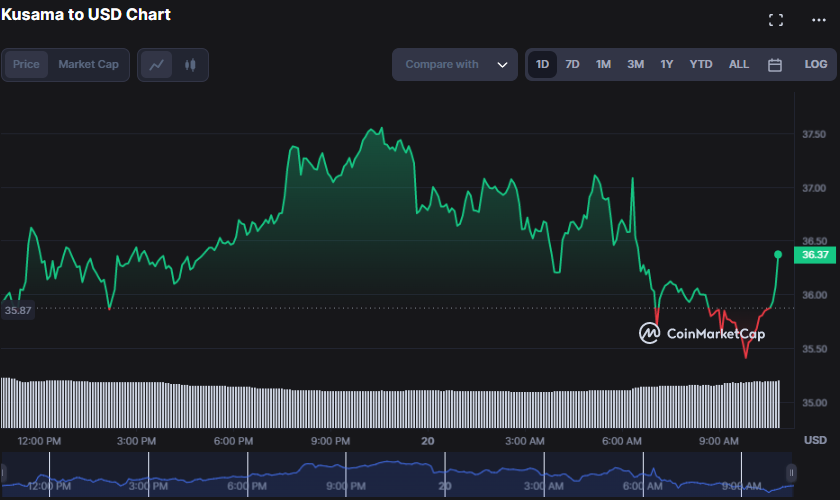
Bullish pressure has been predominant in the Kusama (KSM) market during the last 24 hours, with the price fluctuating between $35.37 and $37.55 thus far. By publication, however, the market’s bullish dominance had slowed, and KSM was trading at $36.02, a gain of 0.34%.
As 24-hour trading volume decreased by 7.03 % to $22,771,413, the market capitalization increased by 0.38% to $305,398,813. Despite the slowdown, investors are still expressing interest in the market, as seen by this movement. However, they may be cautious about making substantial transactions due to the drop in trading volume.
If the bearish trend continues, the $35.37 support level may be broken, and the next support levels may be located at $32.91 and $30.56. A break over the $37.55 resistance level may signify a bullish reversal, opening the door to testing the next resistance at $40.

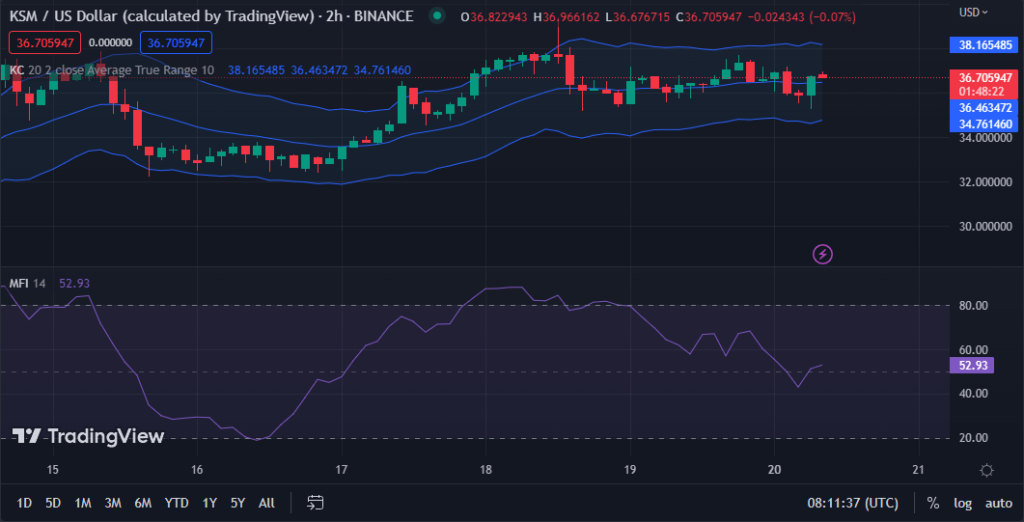
The Keltner Channel bands are broadening on the KSM/USD 4-hour price chart, indicating increasing market volatility. This volatility may imply the possibility of significant price fluctuations soon, which might create trading opportunities for risk-taking traders. The top band hits 38.173982, while the bottom bar touches 34.794381, demonstrating this volatility.
The price action developing a green candlestick as it travels toward the top band indicates that the bullish momentum in the market is still there, and buyers remain in charge. This move increases traders’ expectations of a positive breakout, paving the way for more gains in the KSM market.
The positive sentiment is strengthened as the Money Flow Index(MFI) rises to 52.42, suggesting a probable increase in purchasing pressure and upward momentum in the KSM market. This expectation of a continuous advance is based on the fact that this MFI level indicates that money is coming into the KSM market, which is a good indicator for investors and traders wanting to establish long positions.”

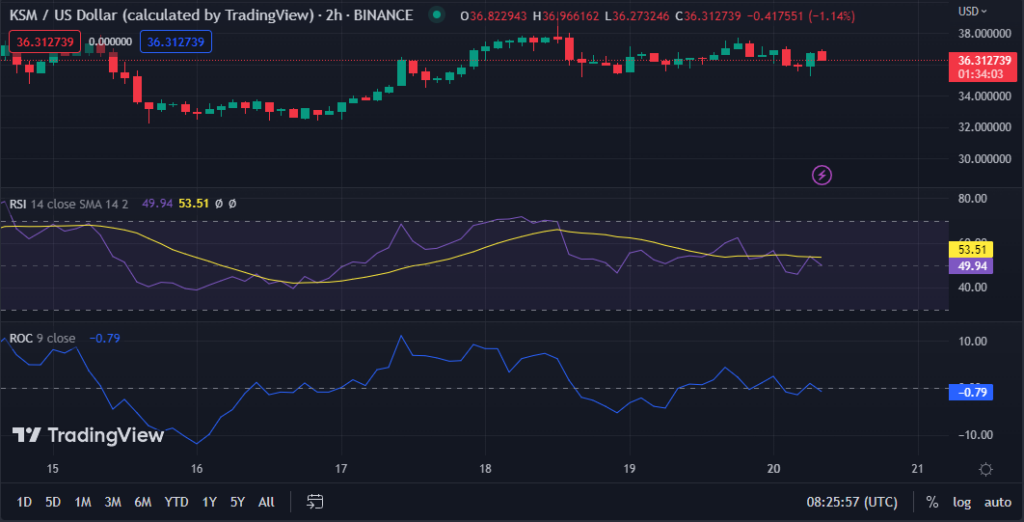
The Relative Strength Index (RSI) has executed a bearish crossing on the KSMUSD chart, moving below its signal line with a value of 52.39. Although the market is buoyant, this move signals that there may be a reverse soon as the RSI indicates that purchasing momentum is diminishing and sellers may begin to take over.
The Rate of Change (ROC) has gone into negative territory with a value of -0.79, supporting this pessimistic perspective. This movement shows that the market’s positive momentum is fading and that a turn to negative sentiment is possible soon.
This move is because a negative ROC indicates that investors are selling off their holdings quicker than earlier, showing a lack of trust in the market’s upward trend.

KSM market sees bullish dominance slowing but volatility increasing, creating trading opportunities as investors remain cautiously optimistic.
Disclaimer: The views, opinions, and information shared in this price prediction are published in good faith. Readers must do their research and due diligence. Any action taken by the reader is strictly at their own risk. Coin Edition and its affiliates will not be liable for direct or indirect damage or loss
Disclaimer: The information presented in this article is for informational and educational purposes only. The article does not constitute financial advice or advice of any kind. Coin Edition is not responsible for any losses incurred as a result of the utilization of content, products, or services mentioned. Readers are advised to exercise caution before taking any action related to the company.


