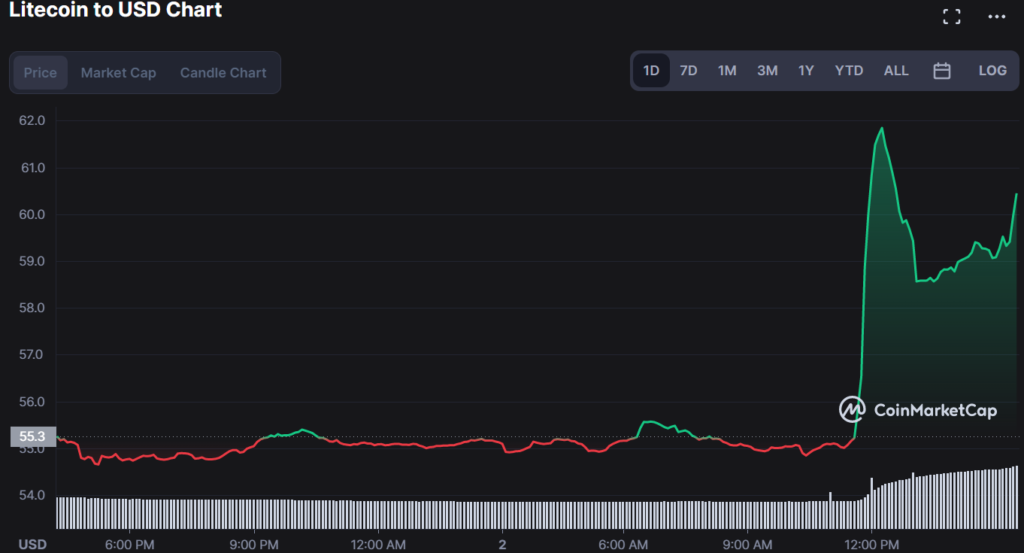
- Litecoin price soars by 7.40%
- Firm resistance is present at $62.00
- LTC’s current support level is found at $55.0
Litecoin price analysis indicates the digital asset is in a firm uptrend after successfully breaking out of its key resistance levels of $55 and $58. The digital asset is currently trading at $60.17, a 7.40% increase in the last 24 hours.LTC/USD bulls appear to have firm control over the market, with strong support at around $55.0 and resistance at $62.00.

The Fibonacci Retracement indicator also shows that Litecoin’s price is currently in the 61.8% retracement zone, indicating a strong trend toward the $62.00 resistance level. However, LTC/USD could face resistance at this level as it coincides with the 200-day moving average line.
LTC is currently trying to break out of the recent turmoil that has been seen in the overall market. This uptrend could continue as bullish sentiment and buying pressure remain strong, with the Relative Strength Index also indicating that LTC is currently in overbought territory.
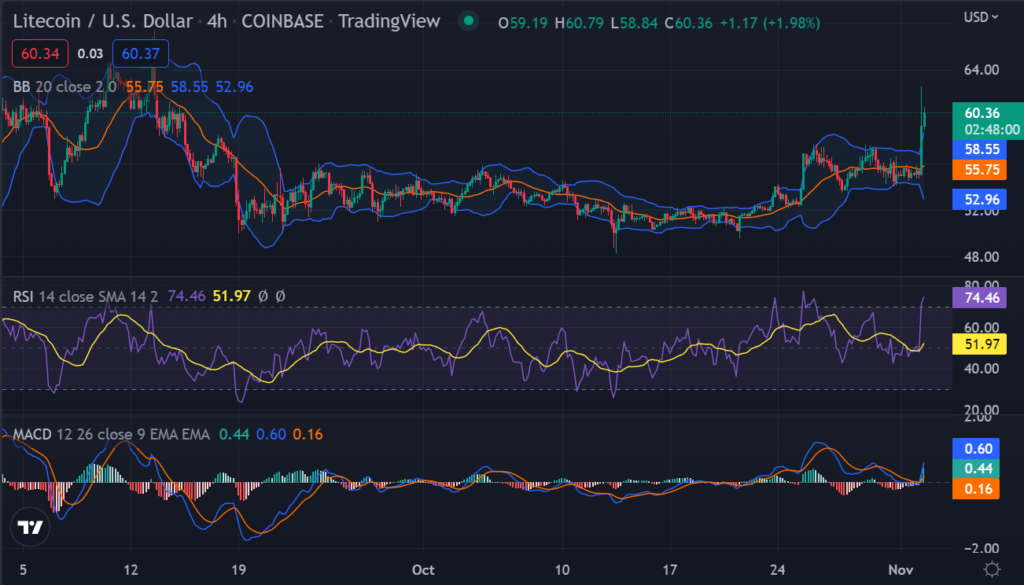
The 4-hour chart analysis shows LTC formed a bullish pennant pattern, with the digital asset successfully breaking out of it to continue its uptrend. The MACD indicator also shows bullish momentum as it moves above the signal line.

The market volatility for the LTC/USD pair has remained high in the last four hours as a significant price change has been seen. The Bollinger bands on the 4-hour chart are currently wide, indicating high levels of volatility. This suggests that LTC/USD could continue to see substantial price movements shortly.
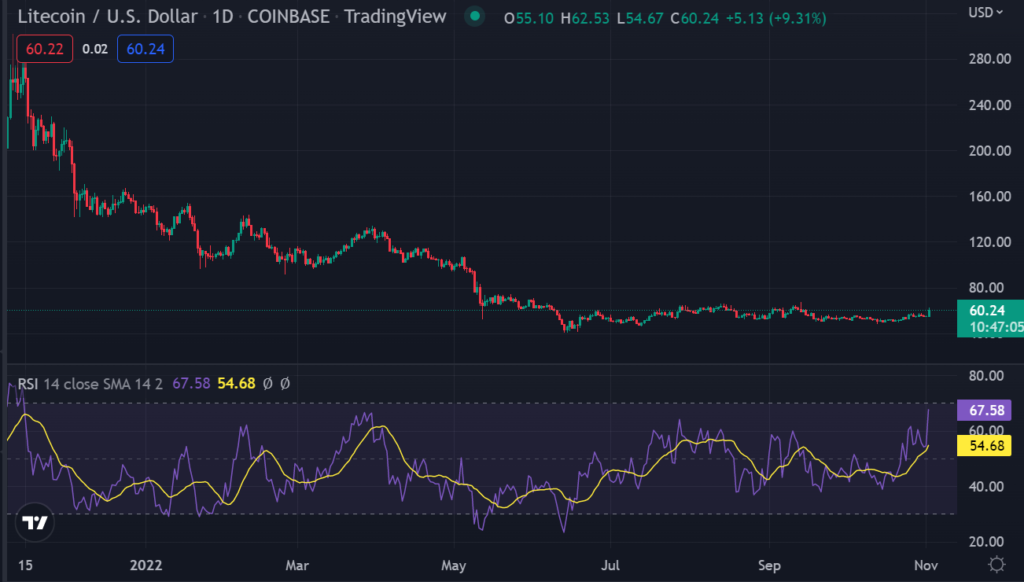
LTC price analysis on the daily chart indicates LTC broke out of its key resistance level at $55.00, with the digital asset currently trading above this level. The RSI also indicates LTC/USD to be in overbought territory, suggesting that a potential price correction could occur.

Litecoin’s current price analysis suggests that the digital asset will continue its bullish run toward $62.The Bears might attempt to push back; however, the bulls appear to have firm control over the market at the moment. It remains to be seen if LTC will continue on its uptrend or if a correction will occur in the near future.
Disclaimer: The views and opinions, as well as all the information shared in this price analysis, are published in good faith. Readers must do their own research and due diligence. Any action taken by the reader is strictly at their own risk. Coin Edition and its affiliates will not be held liable for any direct or indirect damage or loss.
Disclaimer: The information presented in this article is for informational and educational purposes only. The article does not constitute financial advice or advice of any kind. Coin Edition is not responsible for any losses incurred as a result of the utilization of content, products, or services mentioned. Readers are advised to exercise caution before taking any action related to the company.


