- LTC halving disappoints with the bearish trend after slashing miner rewards.
- Bulls in the LTC market struggle to break resistance at $91.42 post-halving.
- Bearish momentum shows signs of weakening, with potential for a bullish reversal.
Despite widespread anticipation, the Litecoin (LTC) halving event on August 2 sparked a bearish trend instead of the expected bullish activity. Consequently, the price of LTC dropped from its pre-halving mark, leaving investors and crypto enthusiasts puzzled.
The halving, an eagerly awaited event by the Litecoin community, saw the miners’ rewards slashed from 12.5 LTC to 6.25 LTC. It’s an occurrence every four years that, in theory, can spur long-term price increases for the native token. Moreover, the halving transpired when the network reached a block height of 2,520,000.
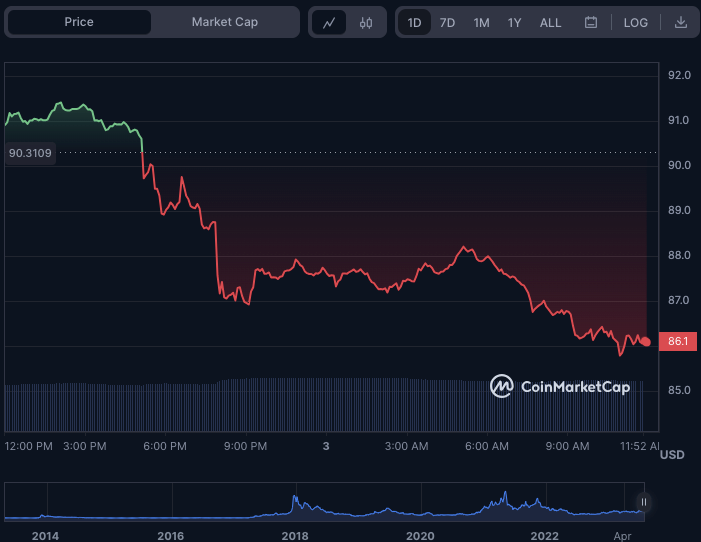
However, the reaction from the market was not as expected. Instead of soaring, the price of LTC struggled to break the resistance level at $91.42. Hence, bearish forces took over, plunging LTC’s price to a 24-hour low of $85.80.
Besides this, the market capitalization of LTC dipped by 5.33%, settling at $6,324,129,454. Significantly, the 24-hour trading volume surged by 8.64% to $852,799,563, a testament to the traders’ heightened activity amidst the halving.
At press time, the price of LTC stood at $85.80, a disappointing 6% decrease from its pre-halving price. This unexpected twist has stirred concerns amongst investors about the short-term prospects of LTC. Additionally, it has led to questions about the potency of halvings as price catalysts.

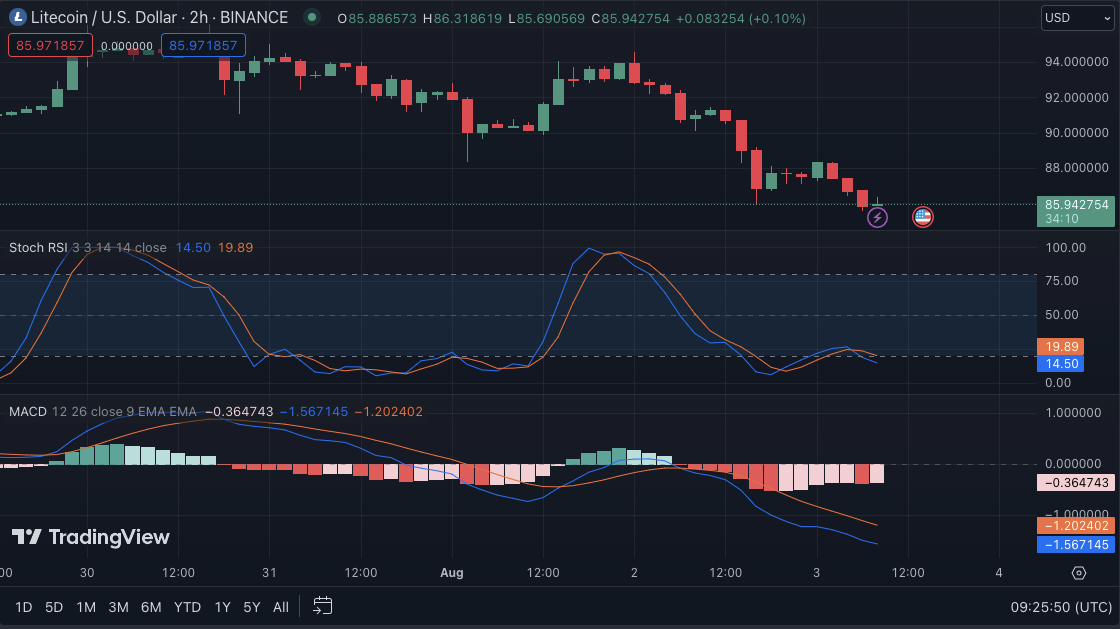
The bearish momentum trend in the LTC market is weakening, with a stochastic RSI rating of 14.66 on the 2-hour price chart. This pattern suggests that the downward pressure on LTC’s price is easing and that a possible reversal or consolidation is on the horizon.
If the stochastic RSI rises above the oversold level of 20, it could signal a shift toward bullish sentiment and potentially attract more buyers into the market.
Further supporting the idea that bearish momentum in the LTC market is waning is the indicator provided by the Moving Average Convergence Divergence (MACD) rating of -1.560798. The negative MACD rating indicates that selling pressure is weakening, potentially paving the way for a bullish reversal.

Bollinger bands converge on the 1-hour price chart, with the upper band touching 89.062868 and the lower band touching 85.535100. This movement indicates a period of consolidation and may suggest that the market is preparing to break out. A break above the upper Bollinger band may indicate a bullish trend, while a break below the lower band may indicate additional bearish pressure.
According to the Relative Strength Index (RSI) rating of 27.98, the market is currently oversold and shifted below its signal line. This level could lead to a price rebound as buyers rush in to take advantage of the lower prices. The increasing volume during the consolidation phase also indicates that traders are active, which supports the possibility of a breakout.

In conclusion, “LTC’s post-halving dip could be paving the way for a rebound, as indicators hint at weakening bearish momentum and potential breakout.
Disclaimer: The views, opinions, and information shared in this price prediction are published in good faith. Readers must do their research and due diligence. Any action taken by the reader is strictly at their own risk. Coin Edition and its affiliates will not be liable for direct or indirect damage or loss.
Disclaimer: The information presented in this article is for informational and educational purposes only. The article does not constitute financial advice or advice of any kind. Coin Edition is not responsible for any losses incurred as a result of the utilization of content, products, or services mentioned. Readers are advised to exercise caution before taking any action related to the company.


