


- LUNA surges 17% from its support, hitting an 11-month high of $1.36.
- Market cap and 24-hour trading volume rose by 17% and 63%, respectively.
- Bull Bear Power (BBP) and RSI suggest a potential bullish trend amid the consolidation phase.
Terra’s (LUNA) bullish momentum has recovered after a bearish trend dipped the price to a 7-day low of $0.7903, marking a significant uptick in its market performance.
However, in the last 24 hours, LUNA’s bullish momentum intensified, fueling a surge from an intra-day low of $1.078 to an 11-month high of $1.36 before facing resistance. At press time, LUNA was exchanging hands at $1.29, a 17% from the support level.
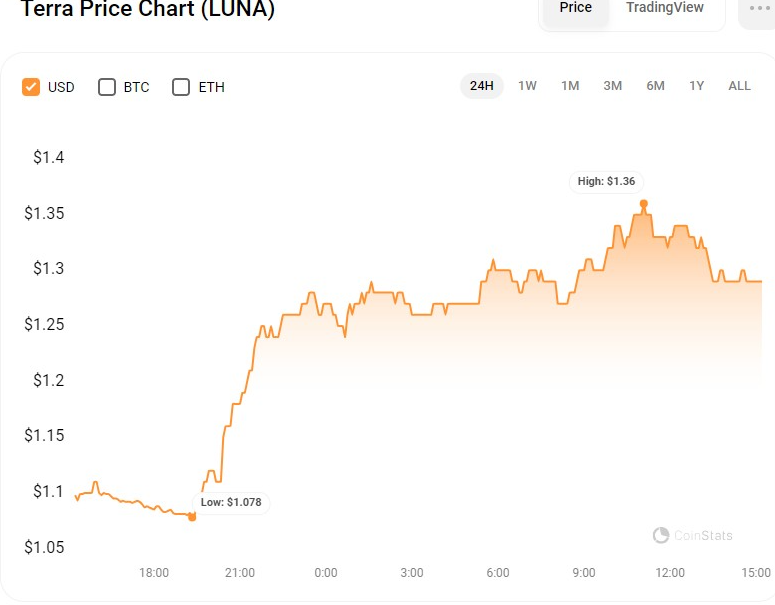
LUNA/USD 24-hour price chart (source: CoinStats)
During the bull rally, LUNA’s market capitalization and 24-hour trading volume surged by 17% and 63%, respectively, to $891,010,861 and $401,868,049. This surge reflects the heightened level of activity and interest among traders in LUNA’s bullish run potential.
As a result, analysts are closely monitoring these developments, as the increased trading volume coupled with the price surge suggests robust market participation and could signal a sustained upward trend for LUNA.
Influence of Do Kwon’s Legal Developments
A significant factor contributing to the recent surge in Terra’s price is the news surrounding Terra’s founder, Do Kwon. Reports of his release to house arrest following a period of legal entanglements have had a noticeable effect on investor sentiment. The positive market reaction can be partially attributed to the alleviation of some of the uncertainties that previously clouded Terra’s outlook due to its association with Kwon’s legal challenges.
The developments in Do Kwon’s legal situation have not only influenced Terra’s market position but have also reignited discussions about the cryptocurrency’s future and its leadership. While the long-term effects of these developments are yet to be fully realized, the immediate market response has been undeniably positive, reflecting a community that is responsive to resolution and clarity.
LUNA/USD Technical Analysis
On the LUNA/USD price chart, the Bull Bear Power (BBP) move into the positive area suggests a possible bullish trend reversal, implying that buyers are gaining momentum in the market. This might enhance purchasing pressure and cause the LUNA/USD price to rise.
Suppose the BBP continues to increase and remain in the positive zone for a lengthy period. In that case, it may confirm the bullish trend and attract additional traders wanting to cash in on the upward momentum.
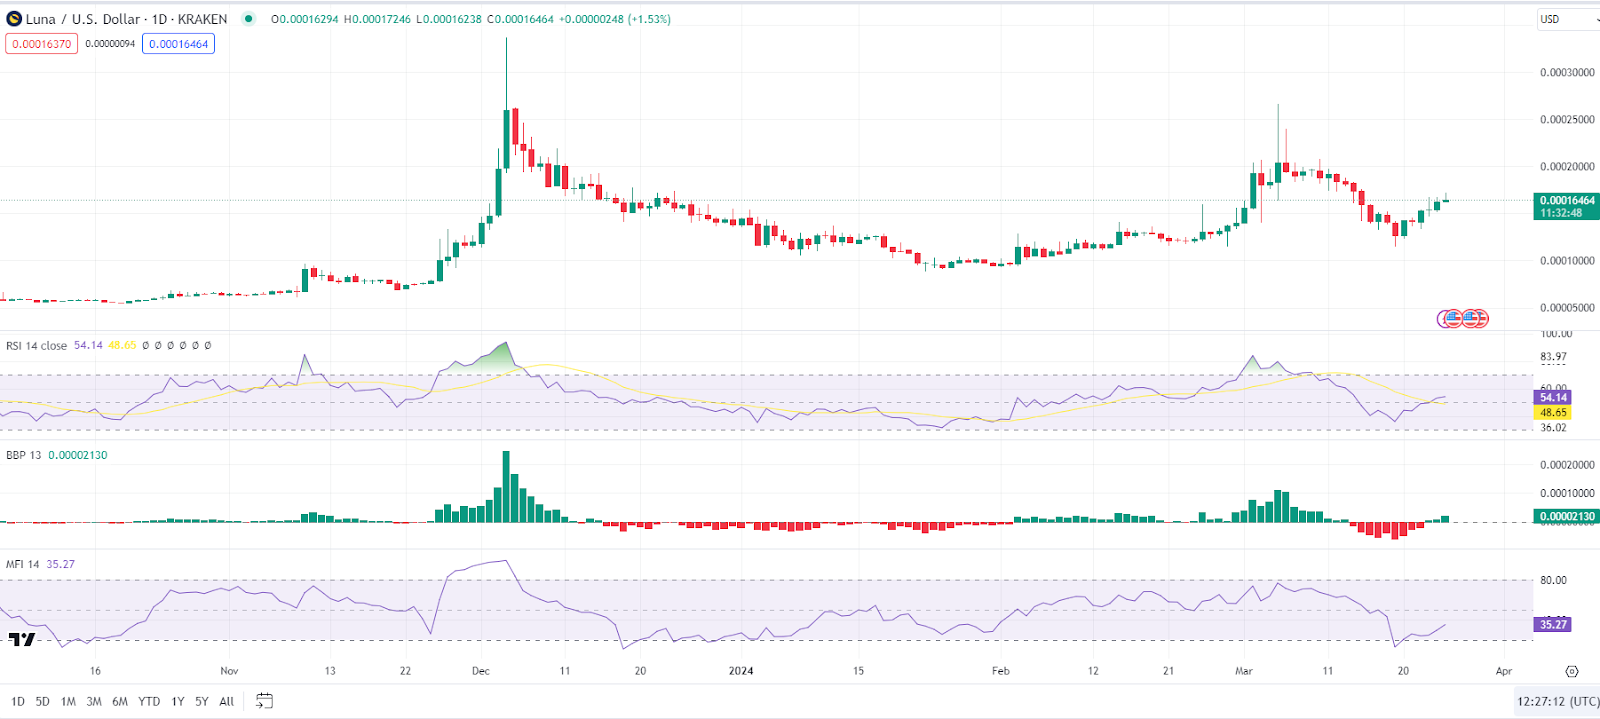
LUNA/USD 24-hour price chart (source: TradingView)
Furthermore, the Relative Strength Index (RSI) rating of 53.71 and the move above the signal line indicate that LUNA/USD is presently in a neutral area, indicating a consolidation period before a potential breakout.
Similarly, the Money Flow Index (MFI) rating of 35.26 and moving upwards suggests that there is still purchasing activity in the market, which might support an additional price rise in the near future. If the MFI continues to increase and goes over 50, it may indicate an increasing bullish mood among investors, resulting in a big price movement.
Disclaimer: The information presented in this article is for informational and educational purposes only. The article does not constitute financial advice or advice of any kind. Coin Edition is not responsible for any losses incurred as a result of the utilization of content, products, or services mentioned. Readers are advised to exercise caution before taking any action related to the company.


 and Litecoin (LTC) Ready for a Bullish Breakout Near Key Resistance Level: Can CYBRO Outshine Them?")


 surges to an 11 month peak, driven by market optimism and significant legal developments surrounding Do Kwon.)