- DAO price research shows a consistent rise.
- The price of Maker DAO has increased by 3.61% over the past day.
- Will the upward trend last?
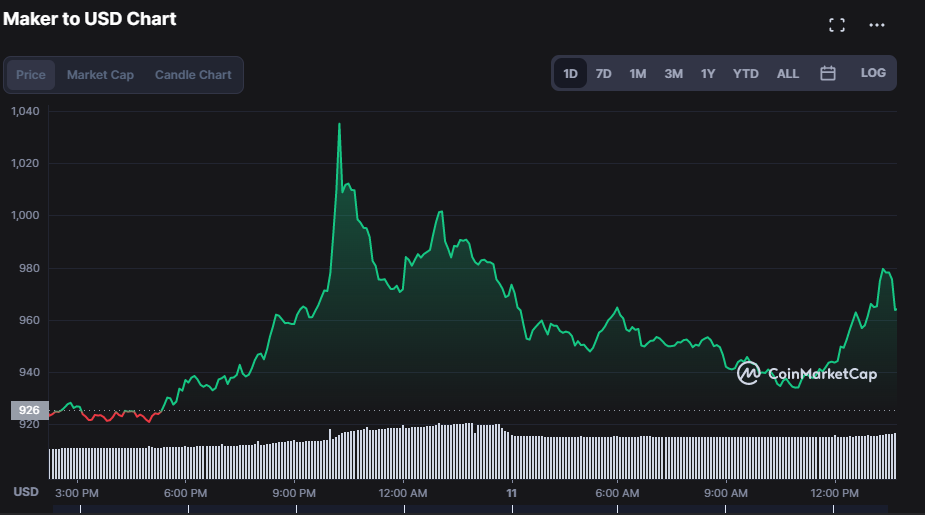
The Maker DAO price analysis on the daily price chart shows that the digital asset has been on a definite upswing for the last day, in line with general market confidence. Since 8 October 2022, the bulls have consistently been in the lead and have taken control of the market, which has caused the price to rise from $920.99 and the 24-hour trading volume to reach its current peak.
Maker DAO was trading up 3.61% against the US dollar at the time of writing and was valued at $958.70. The increased trading activity and market capitalization, which rose by 49.53% to $145,079,211 and 4.23% to $943,587,750, respectively, were ascribed to a price hike.

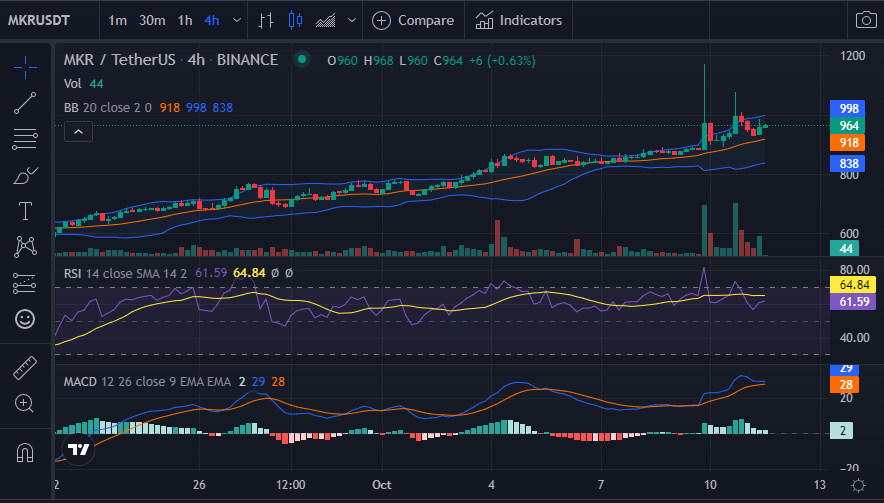
Technical indicators on the daily, hourly, and 4-hour charts all indicate positive momentum, suggesting that the bulls are in charge of the market. The Bollinger Bands are beginning to sag, indicating increased market turbulence. When market volatility increases, it puts additional pressure on the market to buy because it denotes the end of a current trend. The lower band is at a support level of $838, while the upper band is in contact with the $998 resistance level.
According to Maker DAO price analysis, green candlesticks have formed, pointing to an upswing for the token. Investors are drawn to buy Maker DAO because the MACD blue line is currently in the positive area and has passed the signal line. The MACD histogram is also in the positive area, indicating an upward tendency.
As of this writing, the Relative Strength Index (RSI) is at 61.74, which shows that the market is healthy because it is not in the overbought or oversold zone. The bullish trend may continue as a result of this.

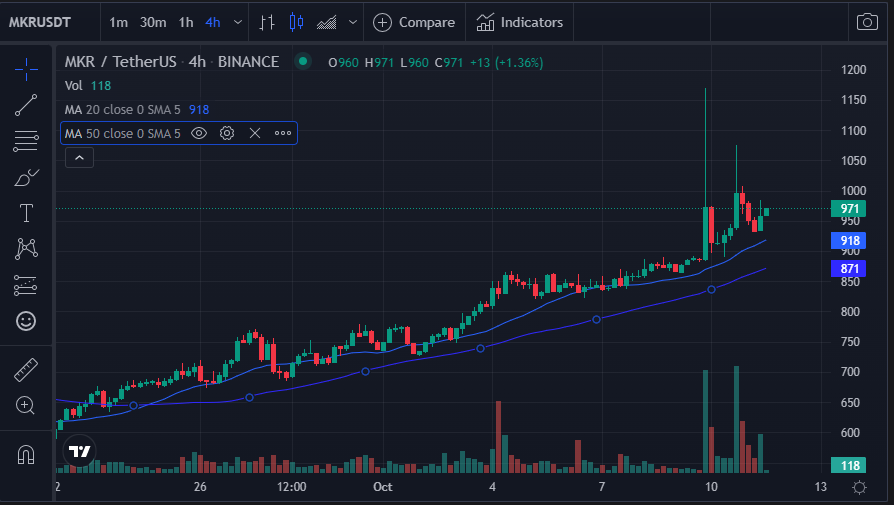
The 20-day Moving Average has surpassed the 50-day Moving Average, creating a golden cross that can be seen on the Maker DAO price chart. The 20-day MA is $918, while the 50-day MA is $871. A crossover involving DAO’s 20-day MA gave rise to the bullish breakout pattern known as the golden cross. The golden cross, which is supported by large trade volumes and gives greater weight to the 50-day MA, signals the impending start of a bull market.

Overall, the buying pressure has typically been so strong that prices have risen to recent highs. Bulls are also working to maintain prices as they swing between a support level of $920.99 and a resistance level of $1,040.63.
Disclaimer: The information presented in this article is for informational and educational purposes only. The article does not constitute financial advice or advice of any kind. Coin Edition is not responsible for any losses incurred as a result of the utilization of content, products, or services mentioned. Readers are advised to exercise caution before taking any action related to the company.


