 Price Prediction 2025, 2026, 2027, 2028-2030")
After weeks of consolidation, Mantle price has defied the bearish trend with a sharp breakout above the descending channel. Backed by rising momentum and volume inflows, MNT now trades near $0.70, showing signs of sustained upside potential heading into 2025 and beyond.
Mantle (MNT) Price Predictions 2025-2030
Mantle (MNT) Price Prediction 2025
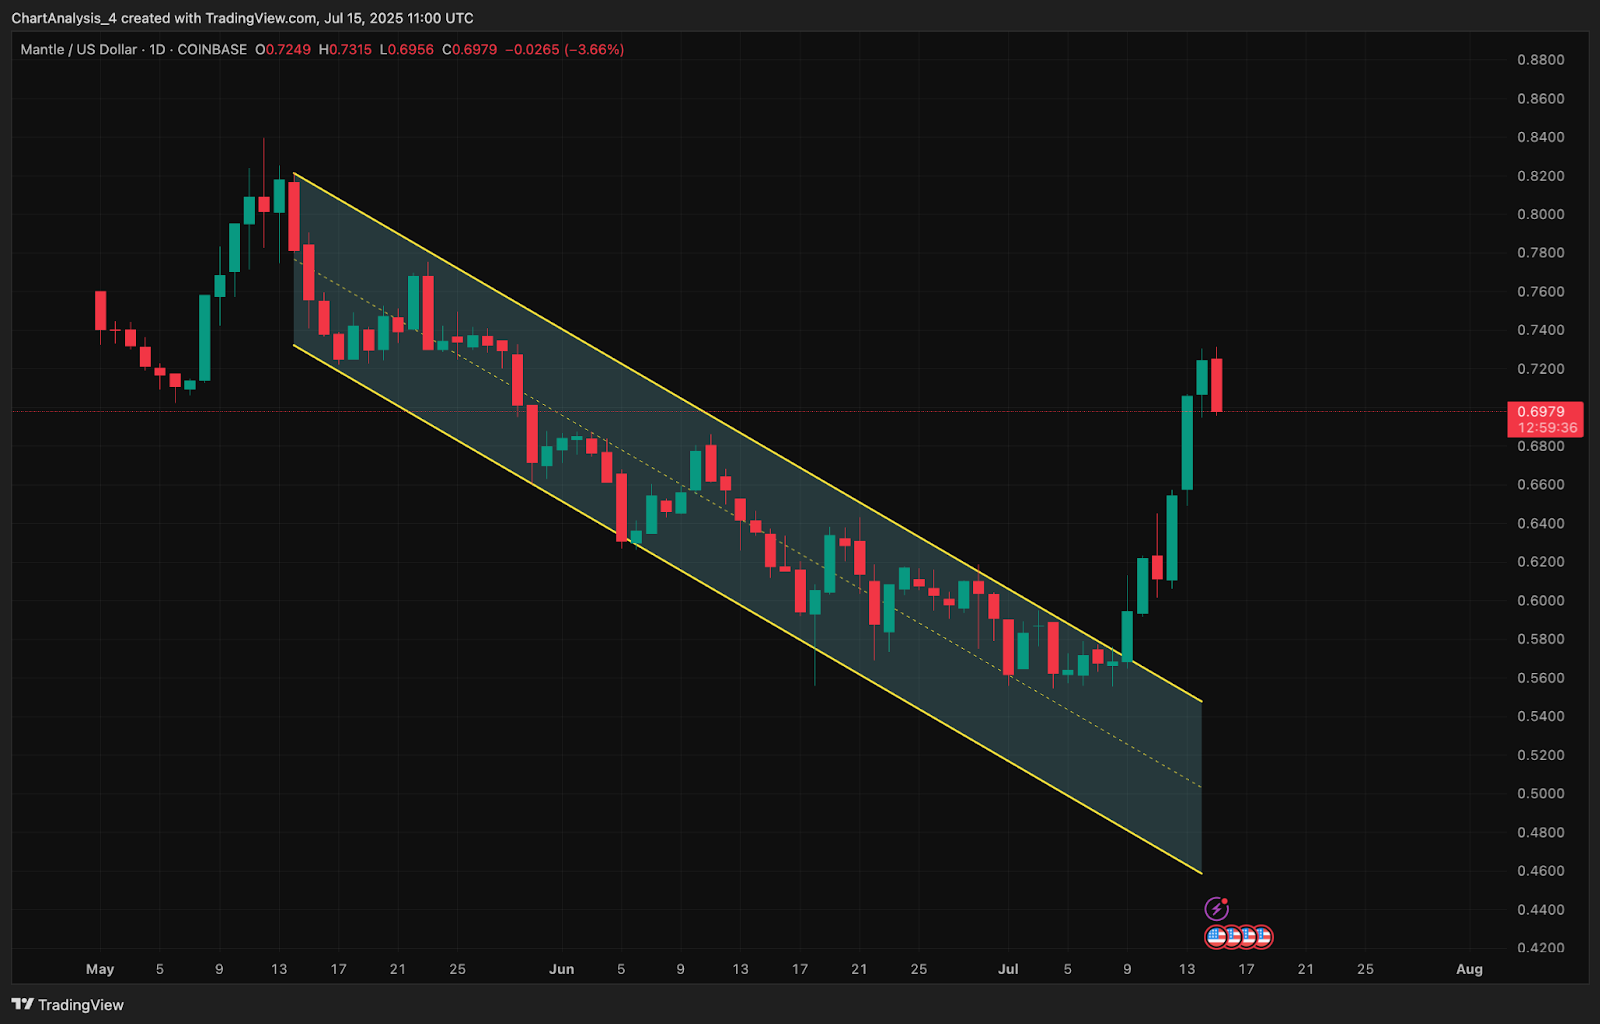
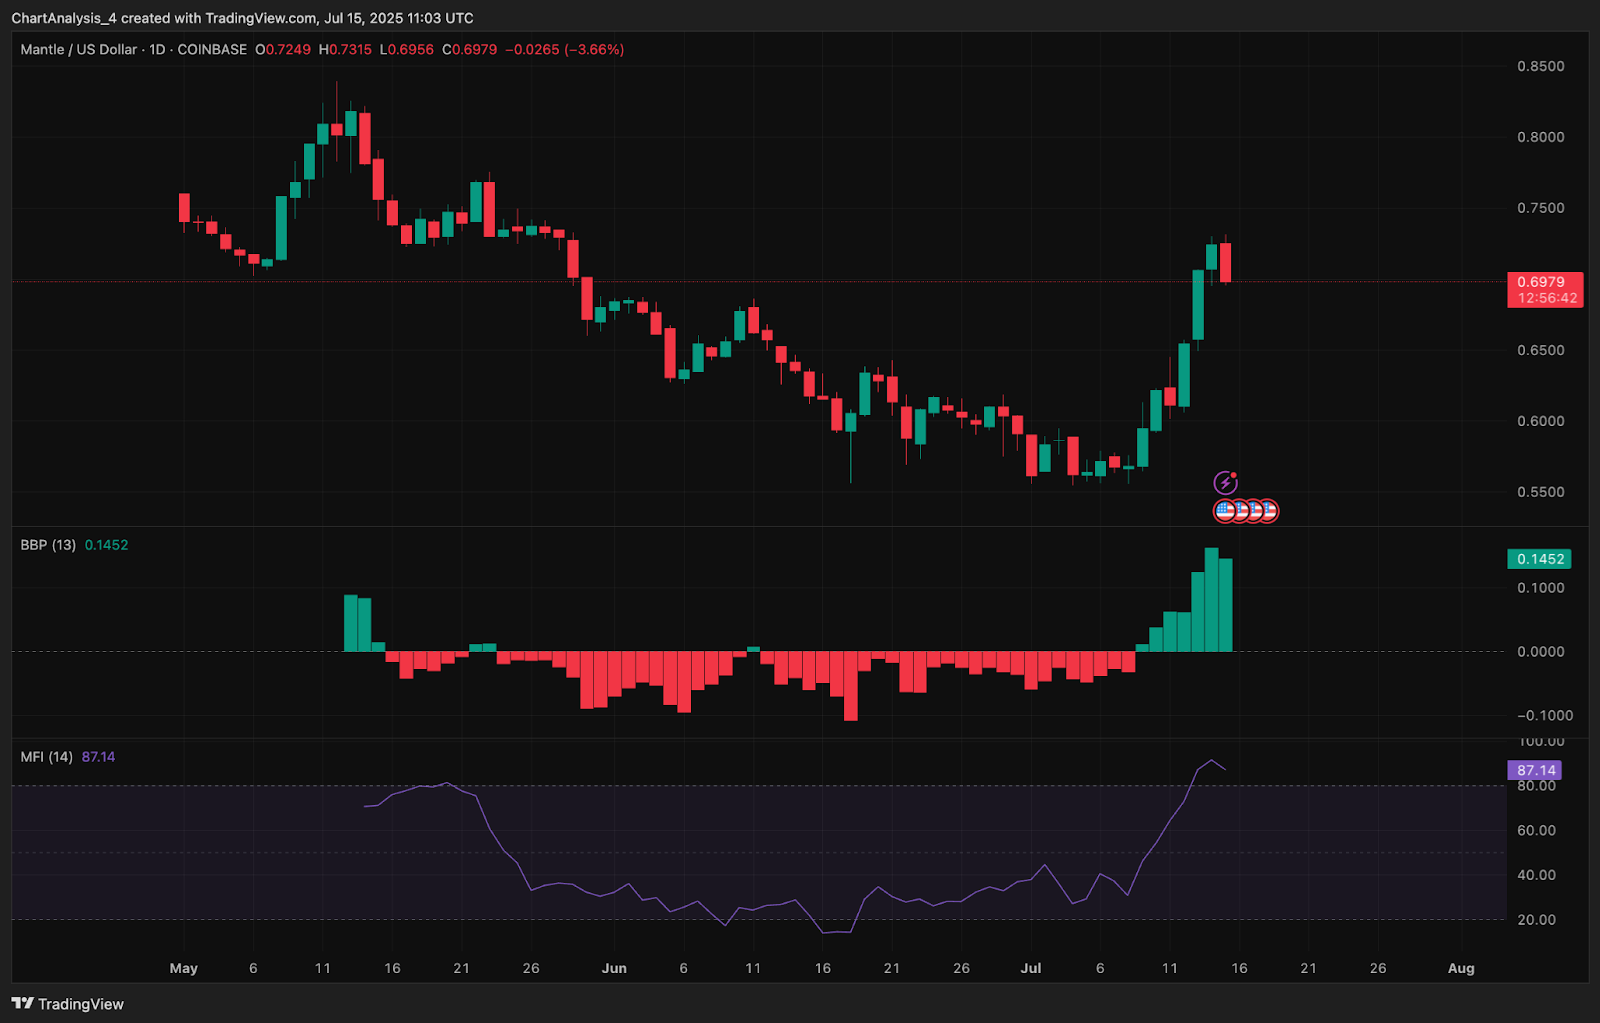
Mantle price today is holding around $0.6979 after rallying over 35% from its July low near $0.5150. The breakout above the long-standing descending channel confirms a trend reversal, placing bulls in control of the mid-term trajectory.
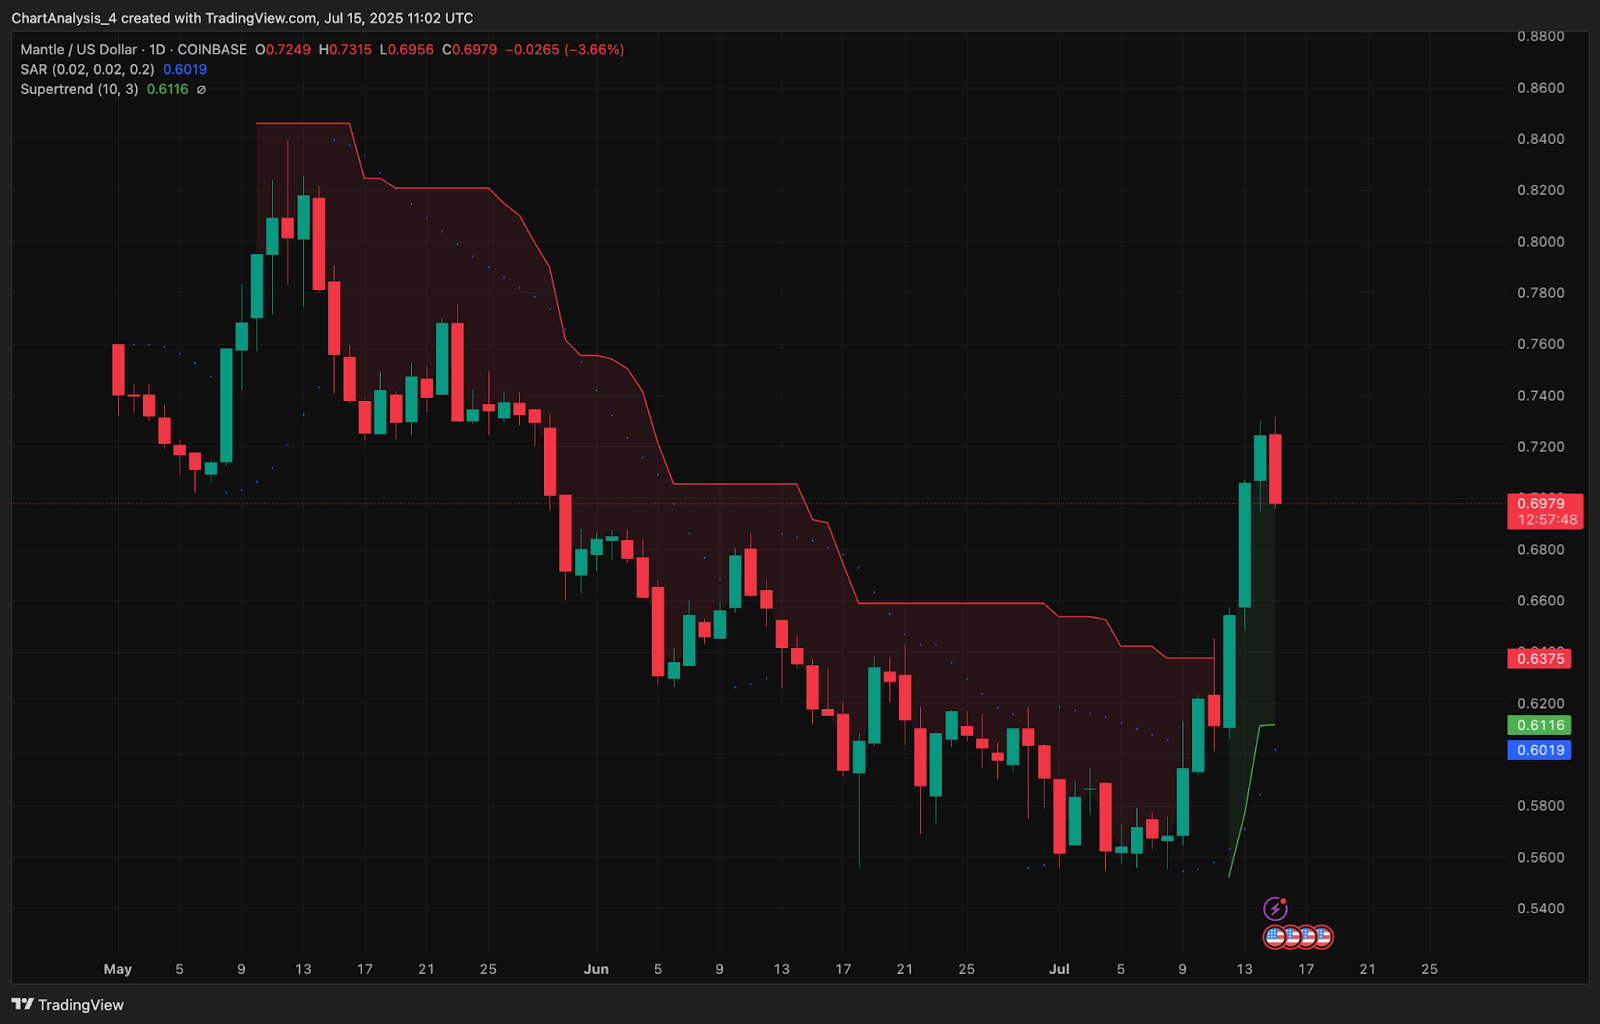
Supertrend has flipped to bullish, now supporting near $0.6375. As long as price sustains above the $0.64–$0.66 zone, MNT may attempt to reclaim the $0.75–$0.78 region in Q4 2025. A close above $0.80 would likely open doors toward the psychological $1.00 handle.
Mantle (MNT) Price Analysis (Signals and Indicators)
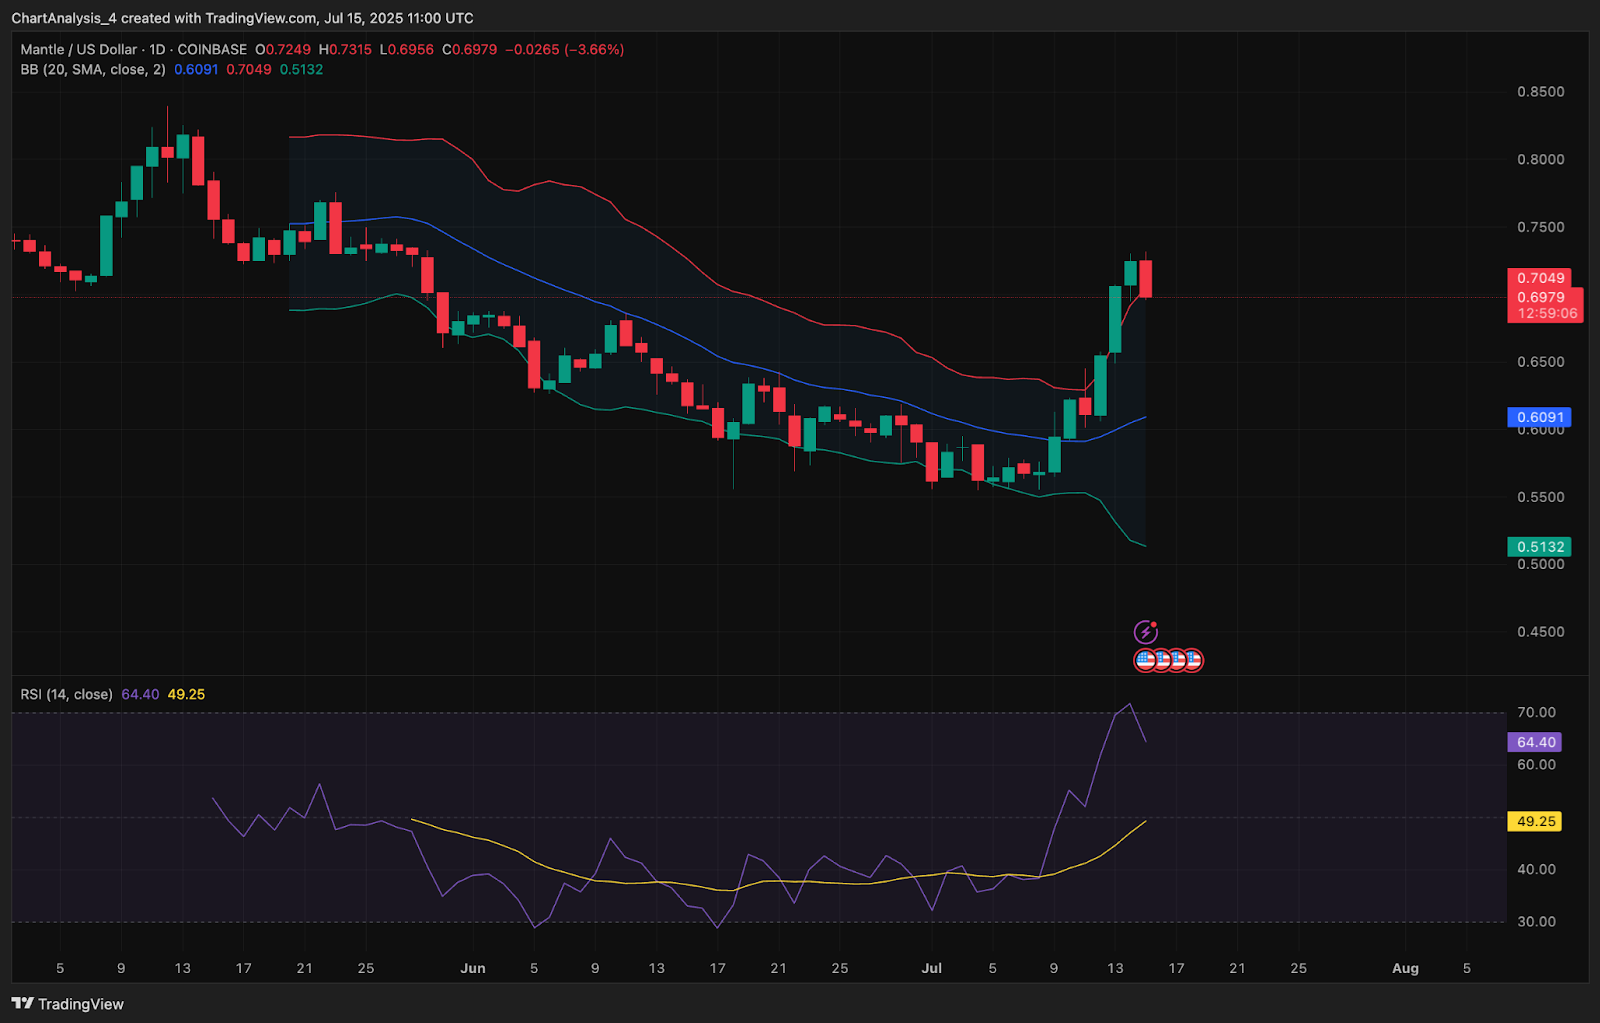
Mantle’s technical landscape turned bullish after breaking out from a two-month falling channel. The daily Bollinger Bands have expanded aggressively, with price tagging the upper band above $0.72. This volatility spike coincides with a bullish shift in BBP (0.1452), hinting at renewed upward strength.
On the daily chart, RSI remains elevated near 64.4, while Money Flow Index (MFI) peaked at 87, reflecting strong buyer interest.
The RSI and MFI continue to hover in bullish territory, although slightly overbought, which may lead to consolidation before a secondary push. The Parabolic SAR dots have aligned below price candles, reinforcing short-term bullish continuation.
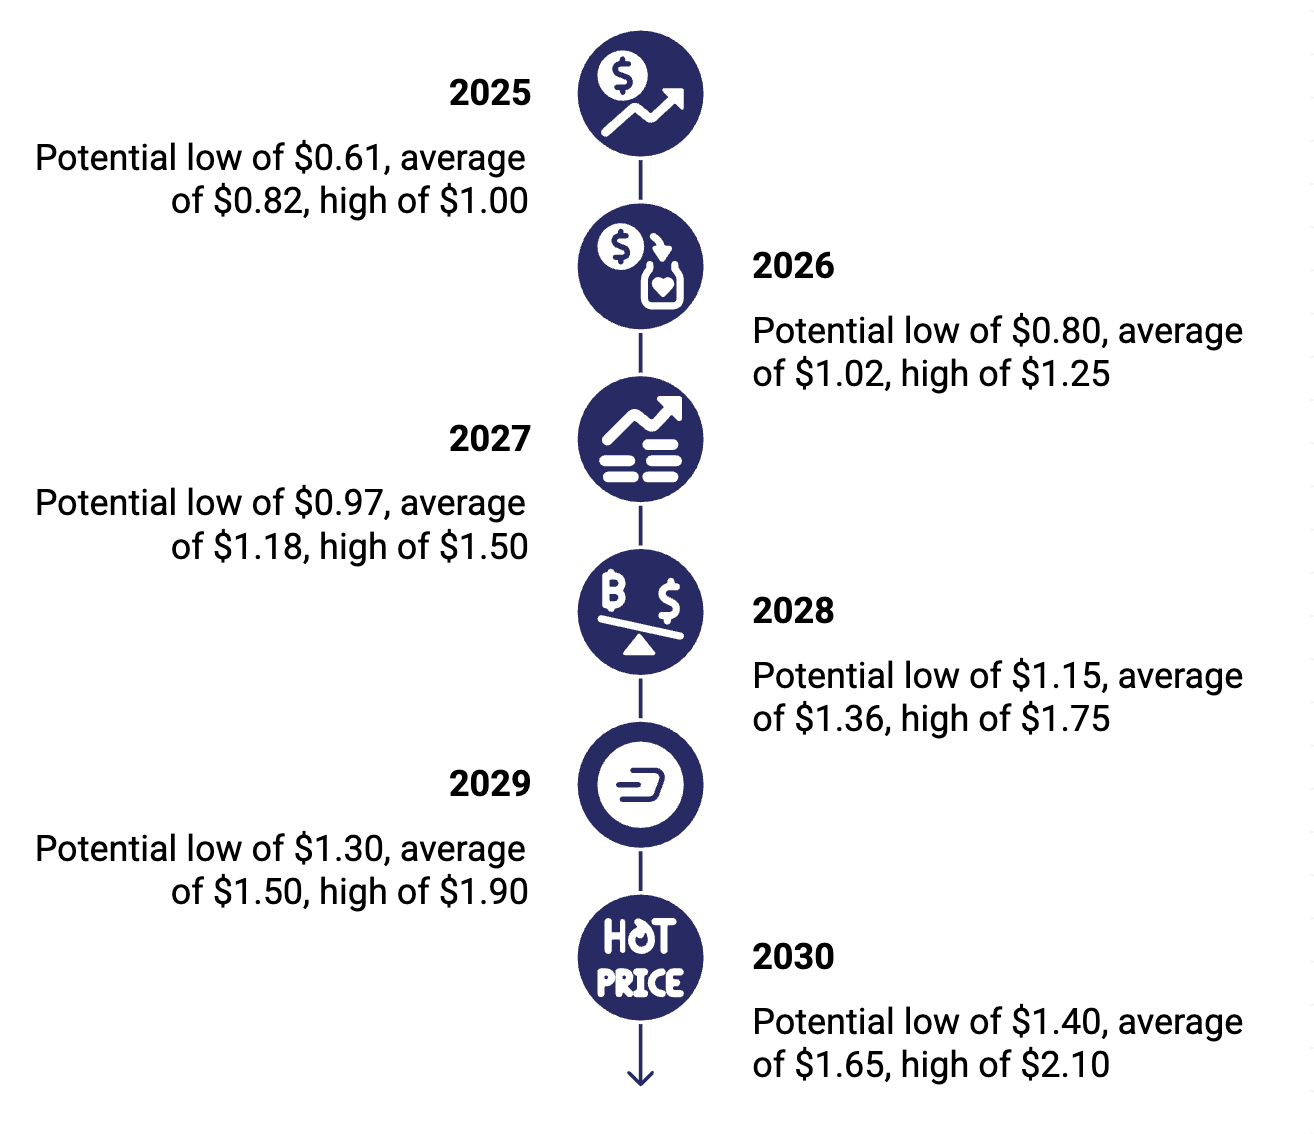
Mantle (MNT) Price Targets 2025–2030
| Year | Potential Low ($) | Potential Average ($) | Potential High ($) |
| 2025 | 0.6100 | 0.8200 | 1.0000 |
| 2026 | 0.8000 | 1.0200 | 1.2500 |
| 2027 | 0.9700 | 1.1800 | 1.5000 |
| 2028 | 1.1500 | 1.3600 | 1.7500 |
| 2029 | 1.3000 | 1.5000 | 1.9000 |
| 2030 | 1.4000 | 1.6500 | 2.1000 |
Mantle (MNT) Price Prediction 2026
By 2026, Mantle price could benefit from continued adoption and increasing ecosystem participation. If the breakout above $1.00 is confirmed and holds, the path toward $1.25 may follow. Historical volume behavior shows that MNT reacts strongly to post-breakout momentum, and any dips into the $0.80–$0.85 range could offer strong accumulation opportunities before the next leg higher.
Mantle (MNT) Price Prediction 2027
In 2027, MNT may enter a consolidation phase with a higher support base. Assuming favorable market conditions and institutional interest in Ethereum L2 projects like Mantle, price could surge beyond $1.50. The rising structure may resemble a mid-cycle continuation, supported by technical strength above $0.97.
Mantle (MNT) Price Prediction 2028
The year 2028 may see renewed interest in scalable blockchain infrastructure, and Mantle could benefit from developer and dApp expansion. If MNT maintains its bullish channel, price may gravitate toward the $1.75 zone. Consolidation above $1.15 would likely support this move, particularly if broader market cycles favor altcoins.
Mantle (MNT) Price Prediction 2029
In 2029, Mantle’s price performance may reflect late-stage cycle strength, with a test of $1.90 plausible. Continued DeFi and Web3 integration could anchor its value proposition. Sustained closes above $1.50 would validate higher targets, while any downside may hold near $1.30.
Mantle (MNT) Price Prediction 2030
By 2030, Mantle price could retest its all-time highs and potentially move into price discovery if adoption accelerates across Layer 2 solutions. With a five-year trajectory of bullish base-building, MNT could see highs near $2.10, with average support consolidating around $1.65. Growth will depend on both ecosystem utility and macro market structure.
Conclusion
Mantle’s recent breakout above the long-standing bearish channel marks a pivotal shift in its technical narrative. With momentum indicators flashing strength and broader market conditions aligning, MNT could be entering a multi-year uptrend cycle. Price targets through 2030 reflect a bullish trajectory backed by structural progress, but short-term volatility may still offer tactical entry zones around $0.64–$0.68.
Disclaimer: The information presented in this article is for informational and educational purposes only. The article does not constitute financial advice or advice of any kind. Coin Edition is not responsible for any losses incurred as a result of the utilization of content, products, or services mentioned. Readers are advised to exercise caution before taking any action related to the company.


