
- OM trading volume surged 65%, signaling strong interest despite price swings.
- MACD crossover hints at early recovery, but RSI remains below neutral levels.
- Support holds at $0.2027, while $0.2150 remains a key resistance to break.
MANTRA (OM) has been on a wild ride lately, leaving investors debating whether the recent price dip offers a smart entry point or signals further downside risk. The token opened the day at $0.2027, climbed to a session high above $0.215, and then gave up gains later in the day.
The session was defined by a classic battle between conflicting market signals: a massive spike in trading volume met a bearish chart pattern at a key resistance level.
Strong Trading Activity, But Can the Bulls Maintain Momentum?
OM’s 24-hour trading volume spiked nearly 65%, reaching $39.2 million. This surge suggests that interest in the token remains strong despite price volatility.
Moreover, the market cap stands at $203.46 million, and the fully diluted valuation (FDV) hovers around $349.1 million. This results in a healthy volume-to-market cap ratio of 19.22%, indicating decent liquidity for traders.
The price action showed mixed signals throughout the day. Initially, OM followed an upward trajectory before moving sideways and eventually declining.
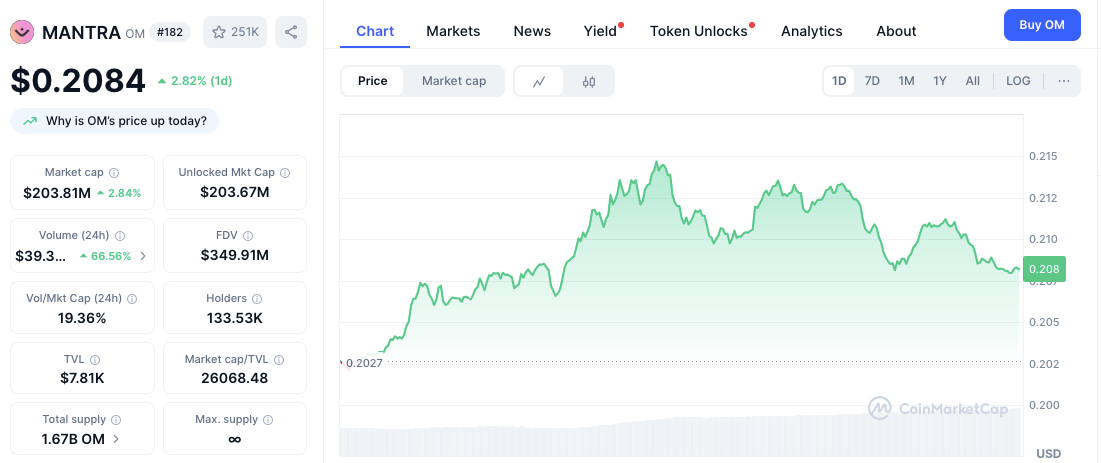
Support has formed at $0.2027, which coincides with today’s opening price and intraday low. A secondary support lies around $0.2050, where the price briefly stabilized during the decline. On the upside, $0.2150 remains the critical resistance. Several failed attempts to clear $0.2125 highlight it as another significant barrier.
Related: MANTRA Launches Investigation into OM Token’s 92% Price Drop – What’s Next?
Technical Indicators Show Early Recovery Signs
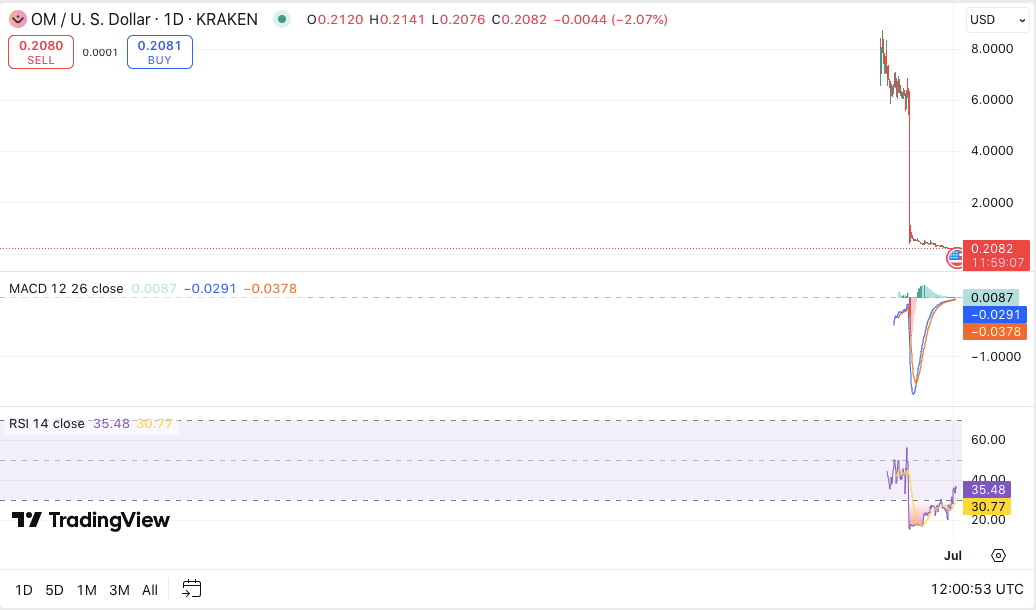
The technical outlook provides a cautiously optimistic picture. The MACD indicator recently displayed a bullish crossover, suggesting the start of a possible recovery trend.
Related: MANTRA Holds Top Spot in RWA Market as Ondo and Maker Trail
The histogram has turned positive, indicating early momentum building. However, the RSI remains at 35.43, still below the neutral 50 mark. Although RSI is moving up from oversold levels, bullish conviction remains limited.
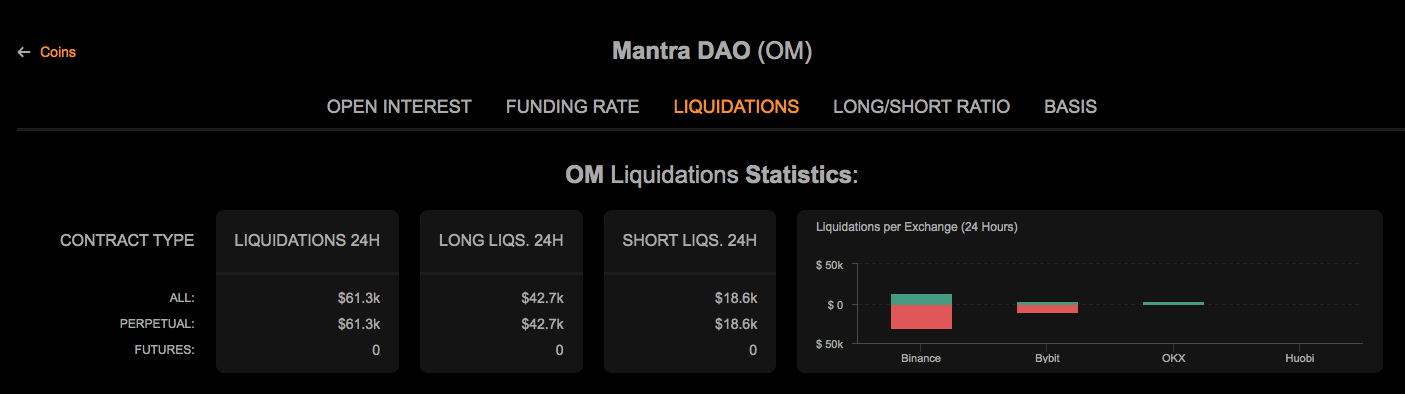
Meanwhile, liquidation data shows heightened activity in perpetual contracts. Total liquidations hit $61.3K, mostly from long positions. Binance saw the most significant liquidations, while Bybit and OKX posted smaller figures. Interestingly, no futures liquidations occurred, showing that risk was mostly concentrated in the perpetual markets.
Disclaimer: The information presented in this article is for informational and educational purposes only. The article does not constitute financial advice or advice of any kind. Coin Edition is not responsible for any losses incurred as a result of the utilization of content, products, or services mentioned. Readers are advised to exercise caution before taking any action related to the company.


