 Price Prediction 2025–2030")
Measurable Data Token (MDT) has posted a parabolic surge, rallying over 100% in a single session and flipping key resistance zones. The price is now testing a significant structure reclaim on both the daily and weekly charts. With momentum indicators stretched but trending higher, MDT may be on the verge of entering a broader recovery cycle through 2025 and beyond.
Measurable Data Token (MDT) Price Prediction 2025
MDT price is currently trading around $0.038 after surging from the $0.018 zone, confirming a strong break-of-structure on both the daily and weekly timeframes. This breakout came after weeks of compression within a rounded base and a clean sweep of lower liquidity near $0.015. Price has now flipped all key short-term EMAs, including the 20, 50, and 100, and is pressing against the 200 EMA at $0.0283.
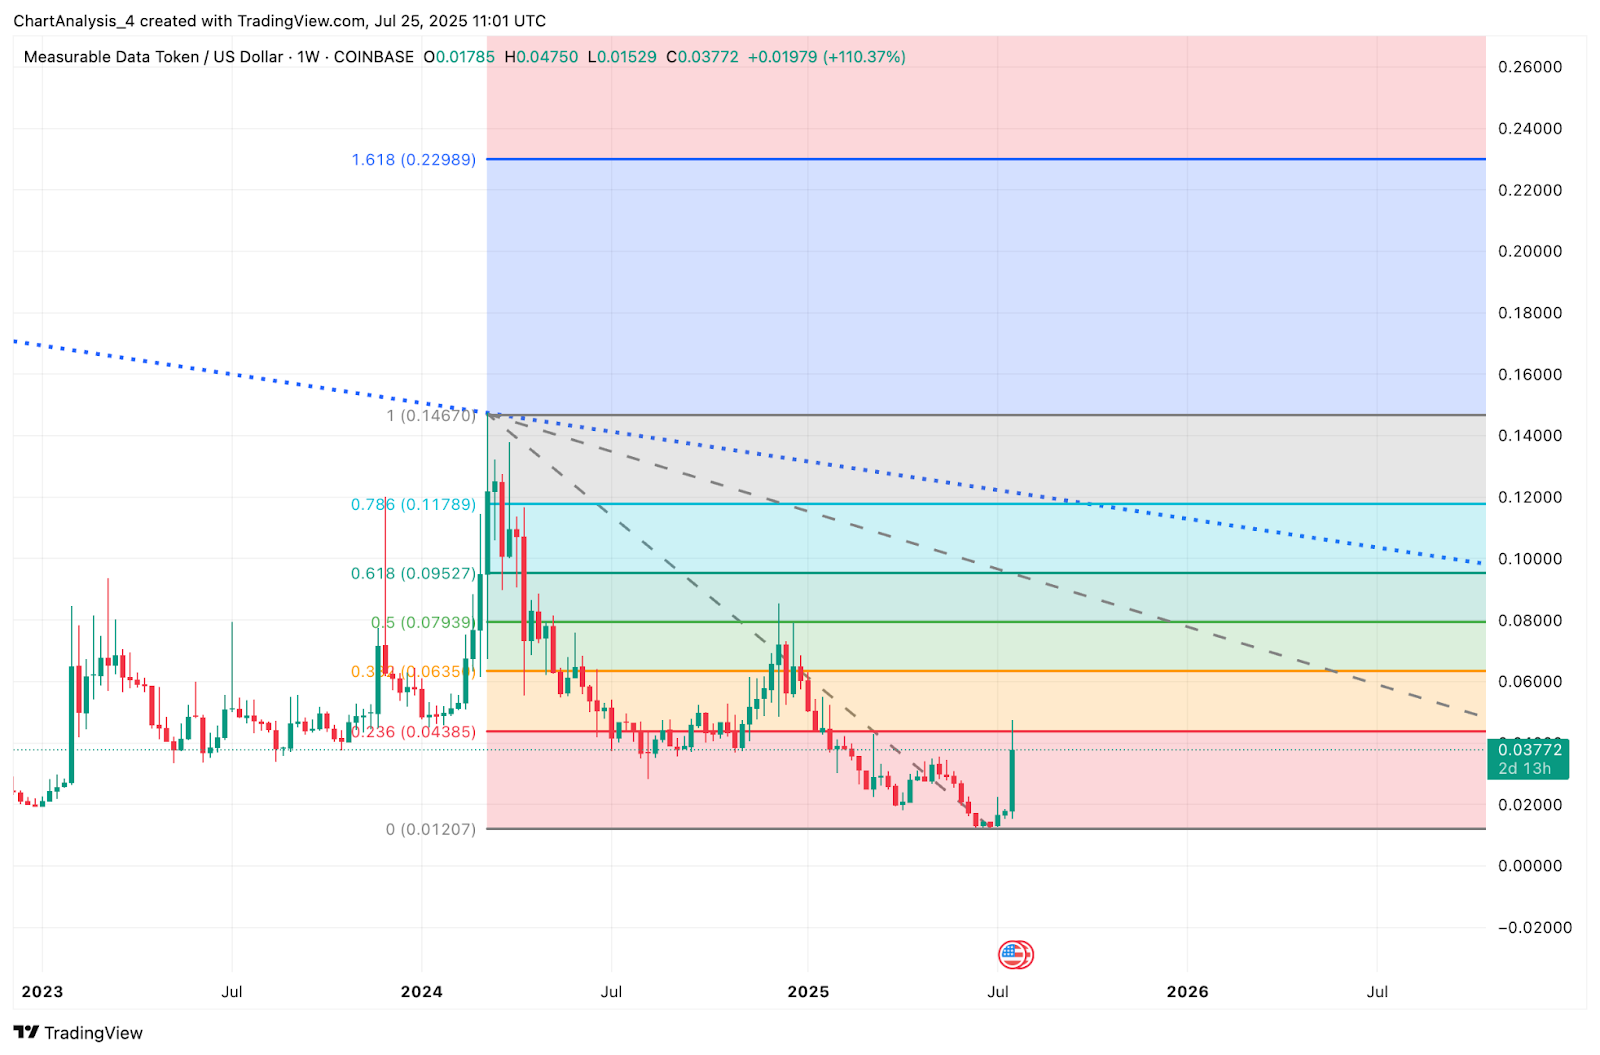
The RSI has entered an extreme overbought zone above 85, which suggests possible short-term cooling but confirms strong underlying demand. On the weekly chart, price has broken above the 23.6% Fibonacci retracement ($0.0438), and could next target the 38.2% Fib at $0.0635 and the 50% zone near $0.0793. These levels coincide with prior supply zones and will be critical to watch.
If MDT consolidates above $0.030 and avoids retracement into the $0.022–$0.025 range, continuation toward the $0.063–$0.079 levels is likely in the second half of 2025. Any failure to hold $0.025 could risk a pullback toward $0.019 support.
Measurable Data Token (MDT) Price Analysis
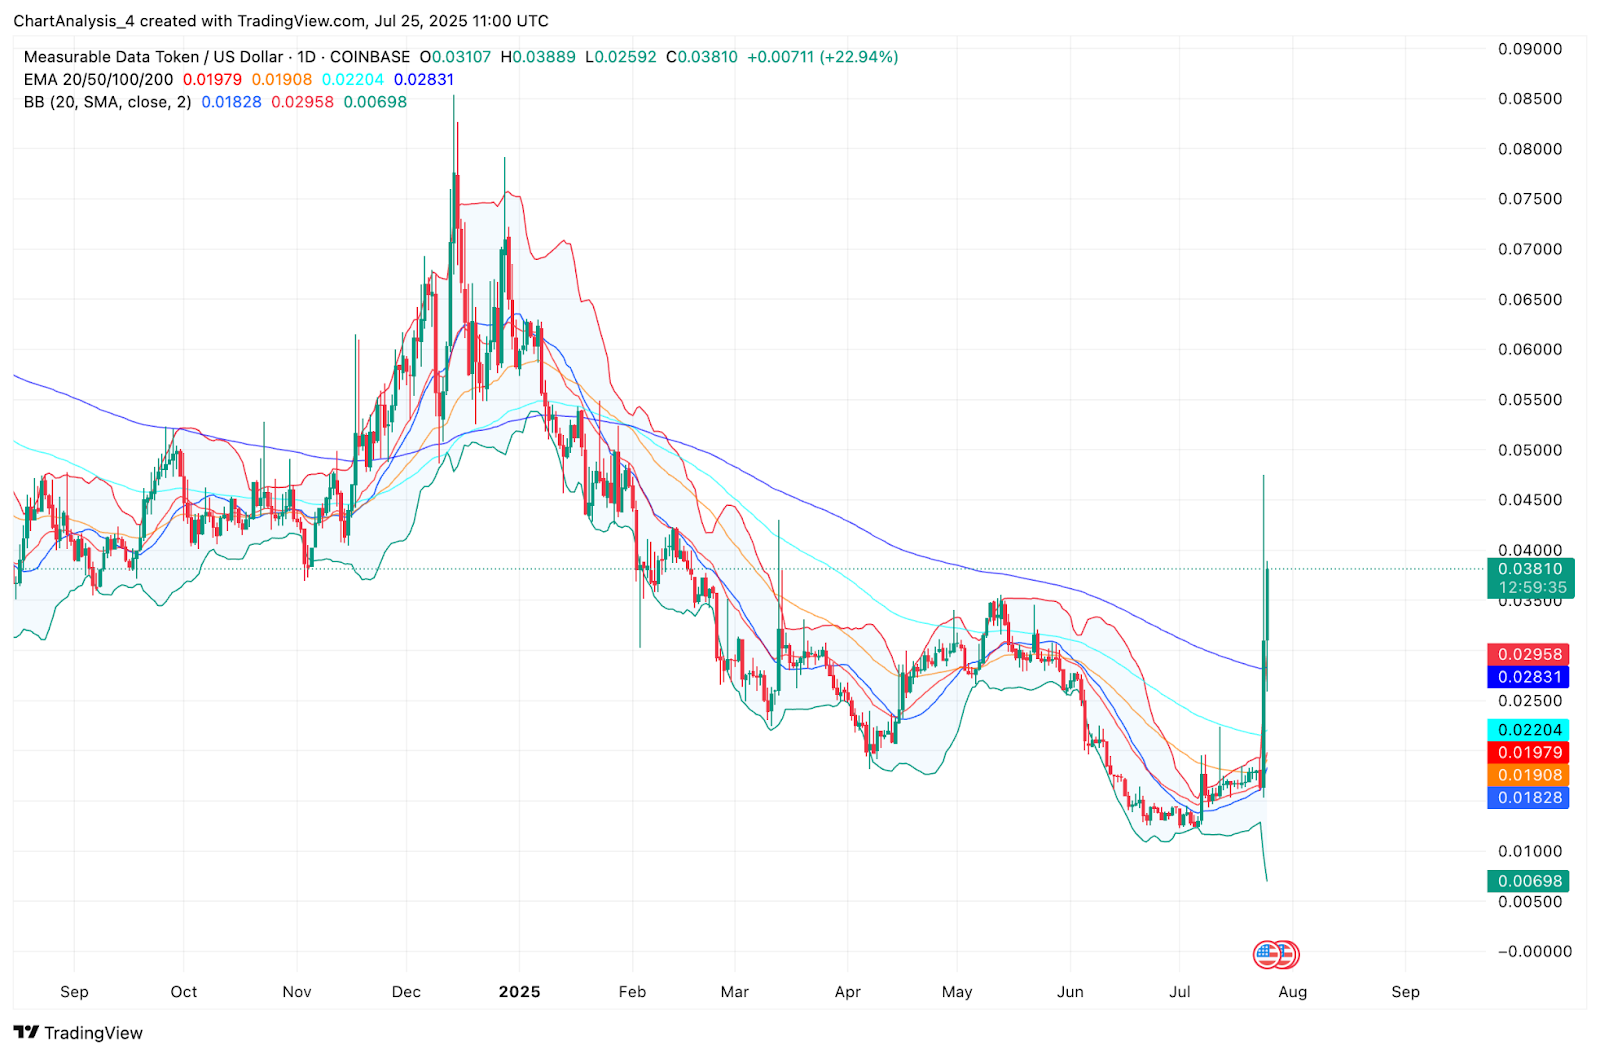
MDT has seen a powerful move through all major EMAs, with the 20 EMA ($0.0197) and 50 EMA ($0.0220) now trending upward. Bollinger Bands are sharply expanded, confirming the volatility breakout. The upper band has pushed toward $0.034, and price has exceeded it, showing strong follow-through strength.
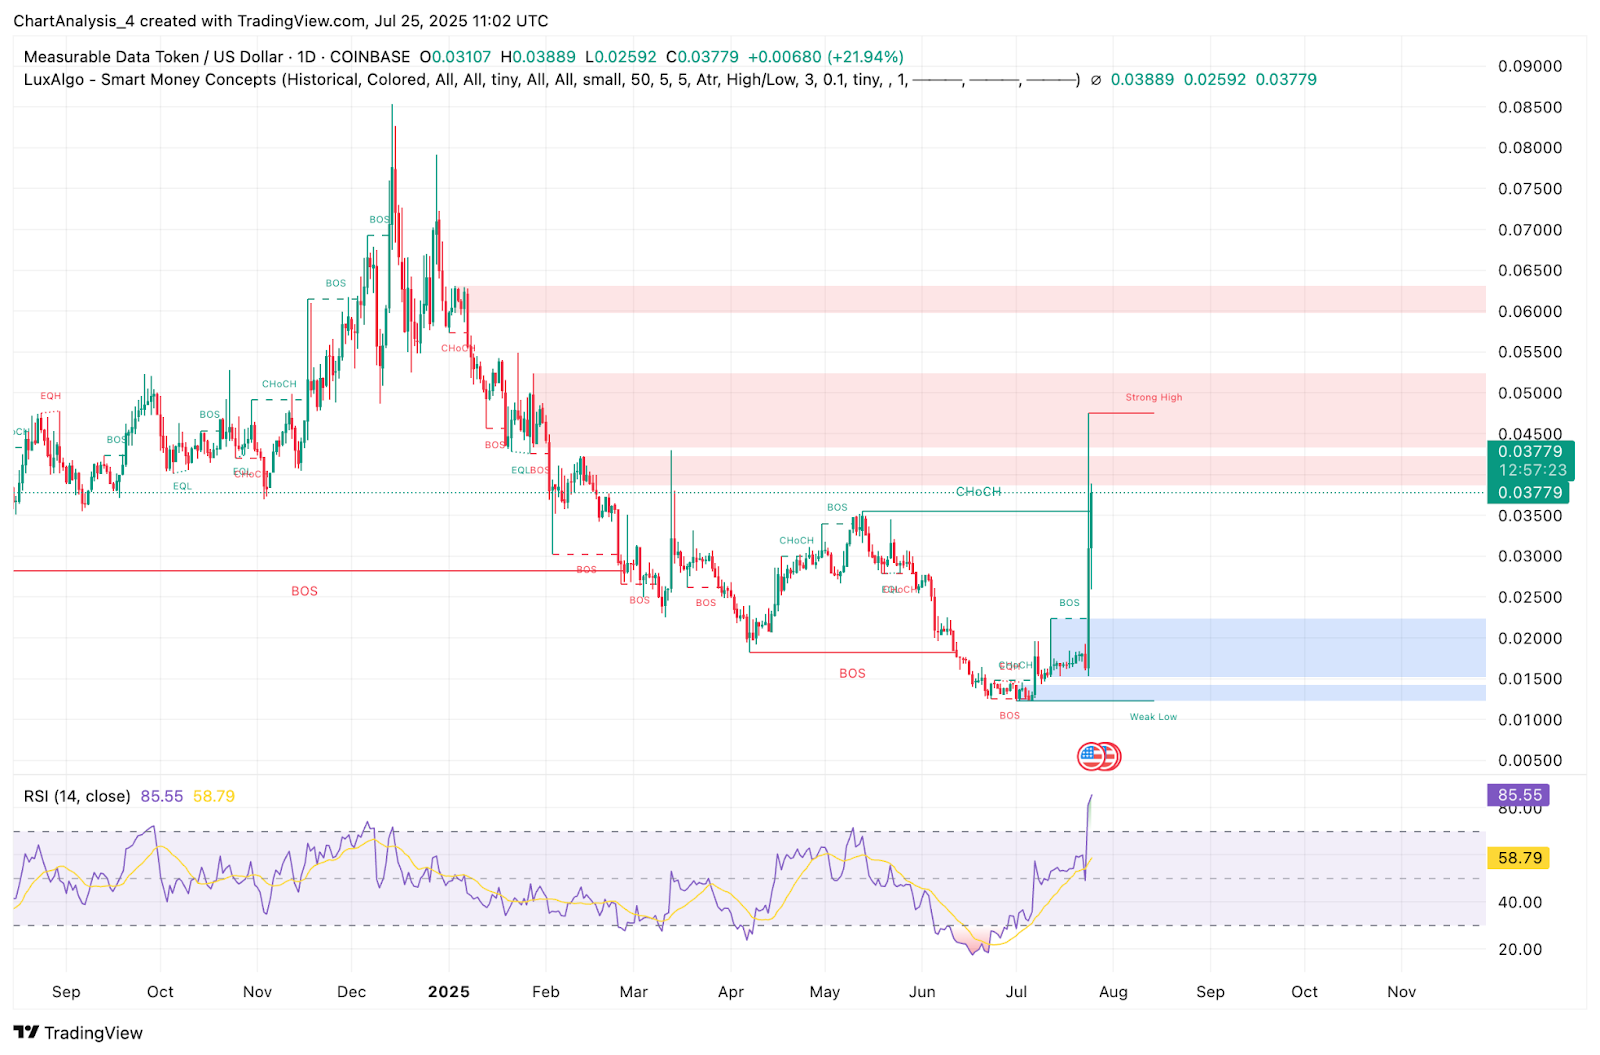
The daily RSI at 85.5 is overbought, typically a sign of short-term overheating, but can remain elevated in explosive uptrends. MACD crossover has triggered, with histogram sharply positive. The Smart Money Concept (SMC) chart shows a confirmed BOS above $0.025 and a clean displacement candle toward the $0.045 mark.
On the weekly Fibonacci retracement chart, the 0.5 Fib ($0.0793) aligns with the previous breakdown zone, while the 0.618 retracement at $0.095 remains a longer-term objective. Price action now targets a reclaim of the descending structure that began near $0.14 in early 2024.
Measurable Data Token (MDT) Price Targets 2025–2030
| Year | Potential Low ($) | Potential Average ($) | Potential High ($) |
| 2025 | 0.022 | 0.045 | 0.079 |
| 2026 | 0.035 | 0.065 | 0.095 |
| 2027 | 0.050 | 0.080 | 0.120 |
| 2028 | 0.060 | 0.095 | 0.145 |
| 2029 | 0.072 | 0.110 | 0.175 |
| 2030 | 0.085 | 0.125 | 0.210 |
Measurable Data Token (MDT) Price Prediction 2026
If MDT holds the higher low structure through 2025 and confirms support near $0.045–$0.050, price could extend toward the 61.8% retracement level at $0.095. A reclaim of this zone may open the door for expansion toward the $0.10–$0.12 range in 2026. Volatility will remain high, but macro structure appears to be shifting bullish.
Measurable Data Token (MDT) Price Prediction 2027
By 2027, the token may consolidate its previous gains and enter a new accumulation cycle. If MDT maintains strength above the $0.065–$0.080 zone, bullish continuation toward $0.12 is likely. Long-term EMAs flattening and price compression under prior highs may create a breakout base.
Measurable Data Token (MDT) Price Prediction 2028
As broader market adoption grows, MDT could benefit from increased data monetization trends. A bullish reclaim of the $0.095–$0.100 zone could set the stage for an advance toward $0.145, especially if weekly demand blocks remain protected. A key higher low near $0.060 may form the foundation for this advance.
Measurable Data Token (MDT) Price Prediction 2029
In 2029, MDT may push toward the $0.175 zone if the asset retains its bullish market structure and avoids deep retracements. The $0.110–$0.125 region may act as a pivot, and weekly closes above $0.120 could confirm a higher timeframe breakout. Momentum indicators may cycle back into bullish territory as trend continuation unfolds.
Measurable Data Token (MDT) Price Prediction 2030
By 2030, MDT could retest the upper bounds of its all-time structure, with possible highs reaching near $0.210. An average near $0.125 would reflect a stable growth trajectory backed by consistent higher low formations and demand zone protection. Upside will depend on broader crypto sentiment and sustained ecosystem development.
Conclusion
Measurable Data Token has reawakened with a powerful breakout, confirming a new bullish phase after an extended downtrend. Price action above $0.030 will be key to sustain momentum into 2026, with targets extending toward $0.095 and beyond. The long-term outlook through 2030 suggests progressive growth if technical levels and demand zones hold. Investors should monitor any retracement back to the $0.022–$0.025 zone as a potential reaccumulation opportunity.
Disclaimer: The information presented in this article is for informational and educational purposes only. The article does not constitute financial advice or advice of any kind. Coin Edition is not responsible for any losses incurred as a result of the utilization of content, products, or services mentioned. Readers are advised to exercise caution before taking any action related to the company.


 Price Prediction: Canton Eyes Key Break After Market Activity Spike")

