 Price Prediction: MemeCore Holds Ground as Bulls Eye Break Above $2")
- MemeCore holds bullish structure as buyers defend key $1.70 support level
- Tight consolidation under $1.85 signals rising pressure for breakout attempt
- Neutral netflows reflect cautious sentiment as traders await confirmation
MemeCore (M) continues to draw strong attention as price action tightens near a key resistance zone. The token currently trades around $1.80, holding firm after a sharp upward rally.
Market participants now watch closely as structure and momentum suggest a potential breakout phase. However, resistance overhead still challenges buyers, making the next move decisive for short-term direction.
Bullish Structure Holds Firm
MemeCore maintains a clear upward trend, supported by consistent higher highs and higher lows. This structure reflects strong buyer control across recent sessions. Moreover, the price remains above all major moving averages, reinforcing bullish momentum. The alignment of short and long-term EMAs further strengthens this outlook.
Besides, recent consolidation appears constructive rather than weak. Price action resembles a bull flag pattern, often signaling continuation.
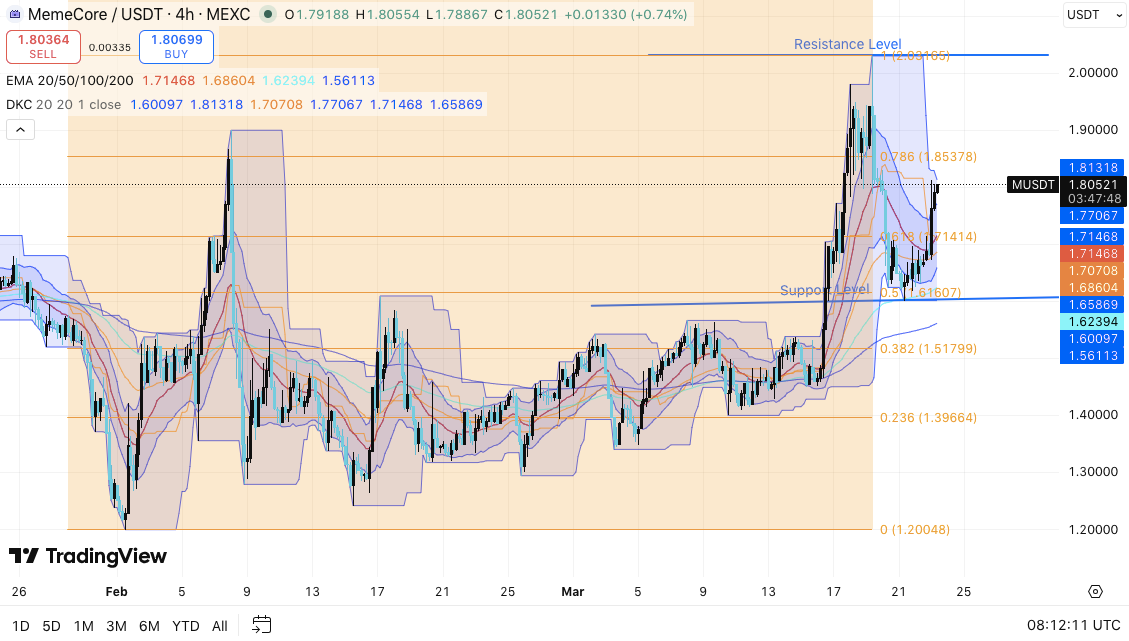
Buyers continue to defend the $1.70 zone aggressively, preventing deeper pullbacks. Consequently, this level now acts as a critical pivot for market sentiment.
Additionally, volatility behavior supports the trend. Price continues to interact with upper volatility bands, indicating sustained strength. Pullbacks remain shallow and controlled, which suggests healthy market conditions rather than exhaustion.
Resistance Test and Breakout Potential
Despite bullish momentum, MemeCore faces immediate resistance between $1.85 and $1.86. This zone has triggered repeated rejections, slowing upward movement. However, sustained pressure near resistance often precedes a breakout.
A decisive move above $1.85 could unlock further upside. Traders may then target $1.95, followed by the psychological $2.00 level. Moreover, a breakout could trigger increased participation, amplifying momentum.
On the downside, losing $1.70 would weaken the current structure. In that case, price could revisit $1.62 or even $1.52. These levels represent deeper support zones where buyers may attempt to regain control.
Market Participation and Sentiment Trends
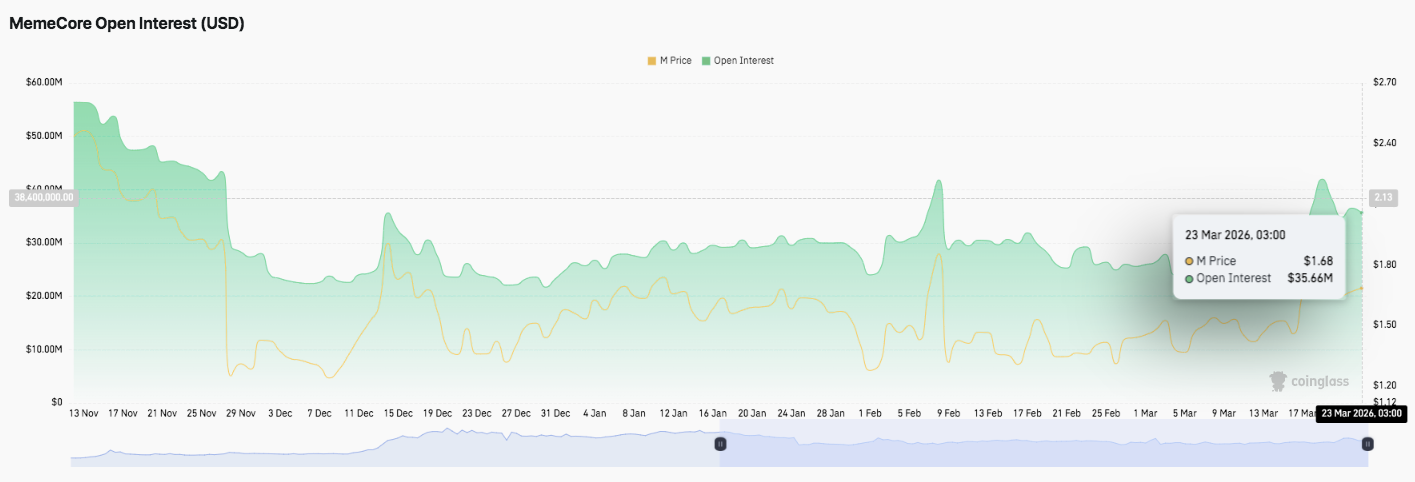
Open interest trends provide additional context for MemeCore’s trajectory. Earlier declines signaled reduced participation and position closures. However, steady recovery through January showed renewed engagement from traders.
Significantly, February introduced sharp fluctuations, reflecting active speculation and shifting sentiment. By March, open interest stabilized, suggesting a more balanced market environment.
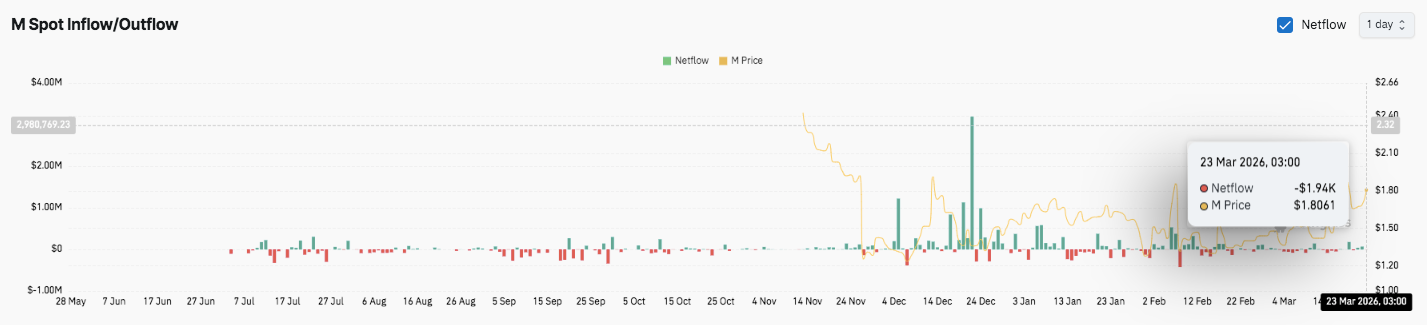
Netflow data adds another layer of insight. Earlier quiet activity gave way to stronger inflows during price expansion. This shift pointed to accumulation. However, recent flows remain mixed, indicating cautious positioning.
Moreover, near-neutral netflows suggest traders now wait for confirmation before committing capital. This hesitation aligns with the current consolidation phase under resistance.
Related: MSBT Is “Massive Bitcoin Bet” With $160B Forecast; Strategy CEO Says
Technical Outlook For MemeCore Price
Key levels for MemeCore remain clearly defined as price compresses below resistance near $1.85. The structure suggests continuation, but confirmation still depends on a breakout.
Upside levels: $1.85–$1.86 remains the immediate barrier. A confirmed breakout could push price toward $1.95, followed by $2.00–$2.03. If momentum accelerates, extension targets may emerge near $2.15.
Downside levels: $1.70 stands as the primary support and trend-defining zone. Below that, $1.62 offers structural backing, while $1.52 represents a deeper demand region.
Resistance ceiling: The $2.00 psychological level remains the key barrier for sustained medium-term expansion. A clean move above this level could shift sentiment decisively bullish.
The technical setup indicates MemeCore trades within a consolidation range after a strong impulsive rally. Moreover, price action resembles a bull flag, which often precedes continuation. However, repeated rejection near $1.85 shows sellers still defend this zone actively.
Related: Analysts Predict How High XRP Could Rise in the Next 3–4 Weeks
Will MemeCore Go Up?
MemeCore’s short-term direction depends heavily on how price reacts around $1.70 and $1.85. If buyers continue defending $1.70, momentum may build for another breakout attempt. Consequently, a move above $1.85 could trigger a rally toward $2.00 and beyond.
Additionally, improving open interest suggests traders gradually re-enter positions. This trend supports the possibility of increased volatility ahead. Netflows, however, remain mixed, indicating cautious sentiment across the market.
On the other hand, failure to hold $1.70 could weaken the bullish structure. In that scenario, price may revisit $1.62 or even $1.52 before stabilizing. Such a move would signal a shift from trend continuation to consolidation or correction.
Overall, MemeCore sits in a pivotal zone where both breakout and pullback scenarios remain valid. Besides, tightening price action often leads to volatility expansion. Hence, the next decisive move will likely define the token’s near-term trajectory.
Disclaimer: The information presented in this article is for informational and educational purposes only. The article does not constitute financial advice or advice of any kind. Coin Edition is not responsible for any losses incurred as a result of the utilization of content, products, or services mentioned. Readers are advised to exercise caution before taking any action related to the company.


