- Monero takes a delve into the red zone before scaling the heights, and reaching $181.
- After rebounding on the 200-day MA, XMR fluctuates between the median upper BB bands.
- RSI register lower lows and XMR could be in for fall. The 200-day MA could interject.
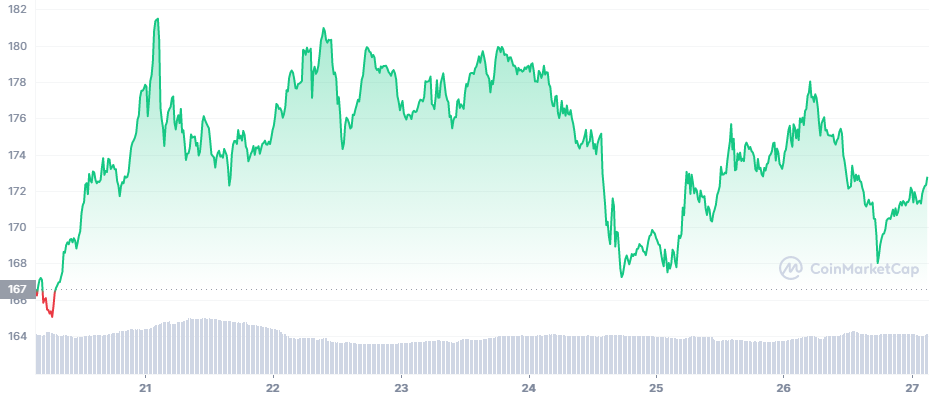
Monero (XMR) has been on a roll when considering the seven day chart below. With an opening market price of $167, XMR took a short dive into the red zone before it began its triumphant march scaling the heights. During its quick dip into the red zone, Monero reached its lowest price of $165.36 on the first day.
However, within a few hours, XMR reached its maximum price of $181.36 on the same day. Thereafter, the token traversed a rugged path with sudden drops and sudden spikes in price. Interestingly, all the spikes and drops hovered within the $172-$180 price range for the next four days of the week.

Three quarters way into the fourth day, the bears managed to get a good grip of XMR and dragged its prices below the $172 range, and XMR reached $167.41. Nonetheless, XMR recovered well and towards the beginning of the sixth day, it reached $177 from as low as $167.
However, this spike was short lived as XMR plummeted back to where it arose from quicker than it took to rise. As such, XMR reached $168. Monero is now in its recovering stages, its price at $172 after it was down by 1.55% in the last 24 hours.
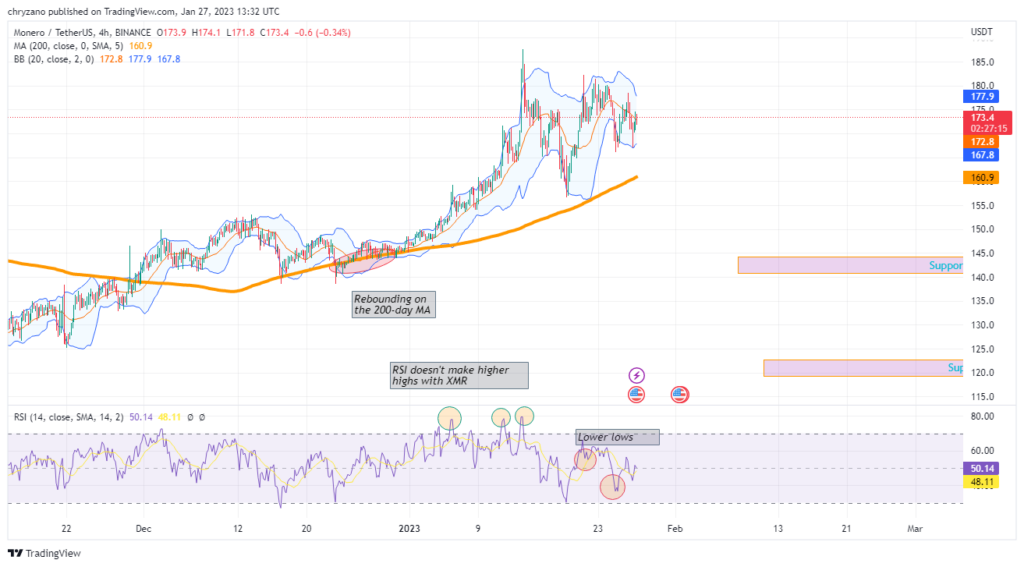
As shown in the chart below, XMR has been fluctuating between the median and the upper Bollinger bands during its exponential rise, after rebounding on the 200-day MA. However, when considering the RSI, it failed to reach higher-highs simultaneously to XMR, as such the bull run was short lived.

With exhaustion of the bulls, XMR no longer could fluctuate near the upper Bollinger, as such its price hit the lower Bollinger band. After hitting the lower band the market has corrected the prices. Monero moved sideways for a brief period but the bears pulled XMR down, as such XMR hit the lower Bollinger band again.
Moreover, XMR is making lower lows along with the RSI, this indicates a bearish sentiment. However, the 200-day MA seems to interject XMR’s fall. If by any chance the 200-day MA gives XMR the needed support like the previous occasion, the token could reach $290.
Contrastingly, if the bulls are strong enough to drag XMR down to the 200-day MA, then it would tank to support 1. Will the 200-day MA cushion XMR’s fall or will the fall be hard enough to fall through the 200-day MA? Time will tell.
Disclaimer: The views and opinions, as well as all the information shared in this price analysis, are published in good faith. Readers must do their own research and due diligence. Any action taken by the reader is strictly at their own risk, Coin Edition and its affiliates will not be held liable for any direct or indirect damage or loss.
Disclaimer: The information presented in this article is for informational and educational purposes only. The article does not constitute financial advice or advice of any kind. Coin Edition is not responsible for any losses incurred as a result of the utilization of content, products, or services mentioned. Readers are advised to exercise caution before taking any action related to the company.


