 Price Prediction for September 2025")
TRUMP trades near $9.01 as September opens, after repeatedly holding the $8.70–$8.80 support zone. The token has spent the past two months compressing inside a descending triangle, with sellers capping rallies near $9.20–$9.30. The technical structure suggests a decisive breakout is likely this month.
EMA and RSI Signal Neutral Bias
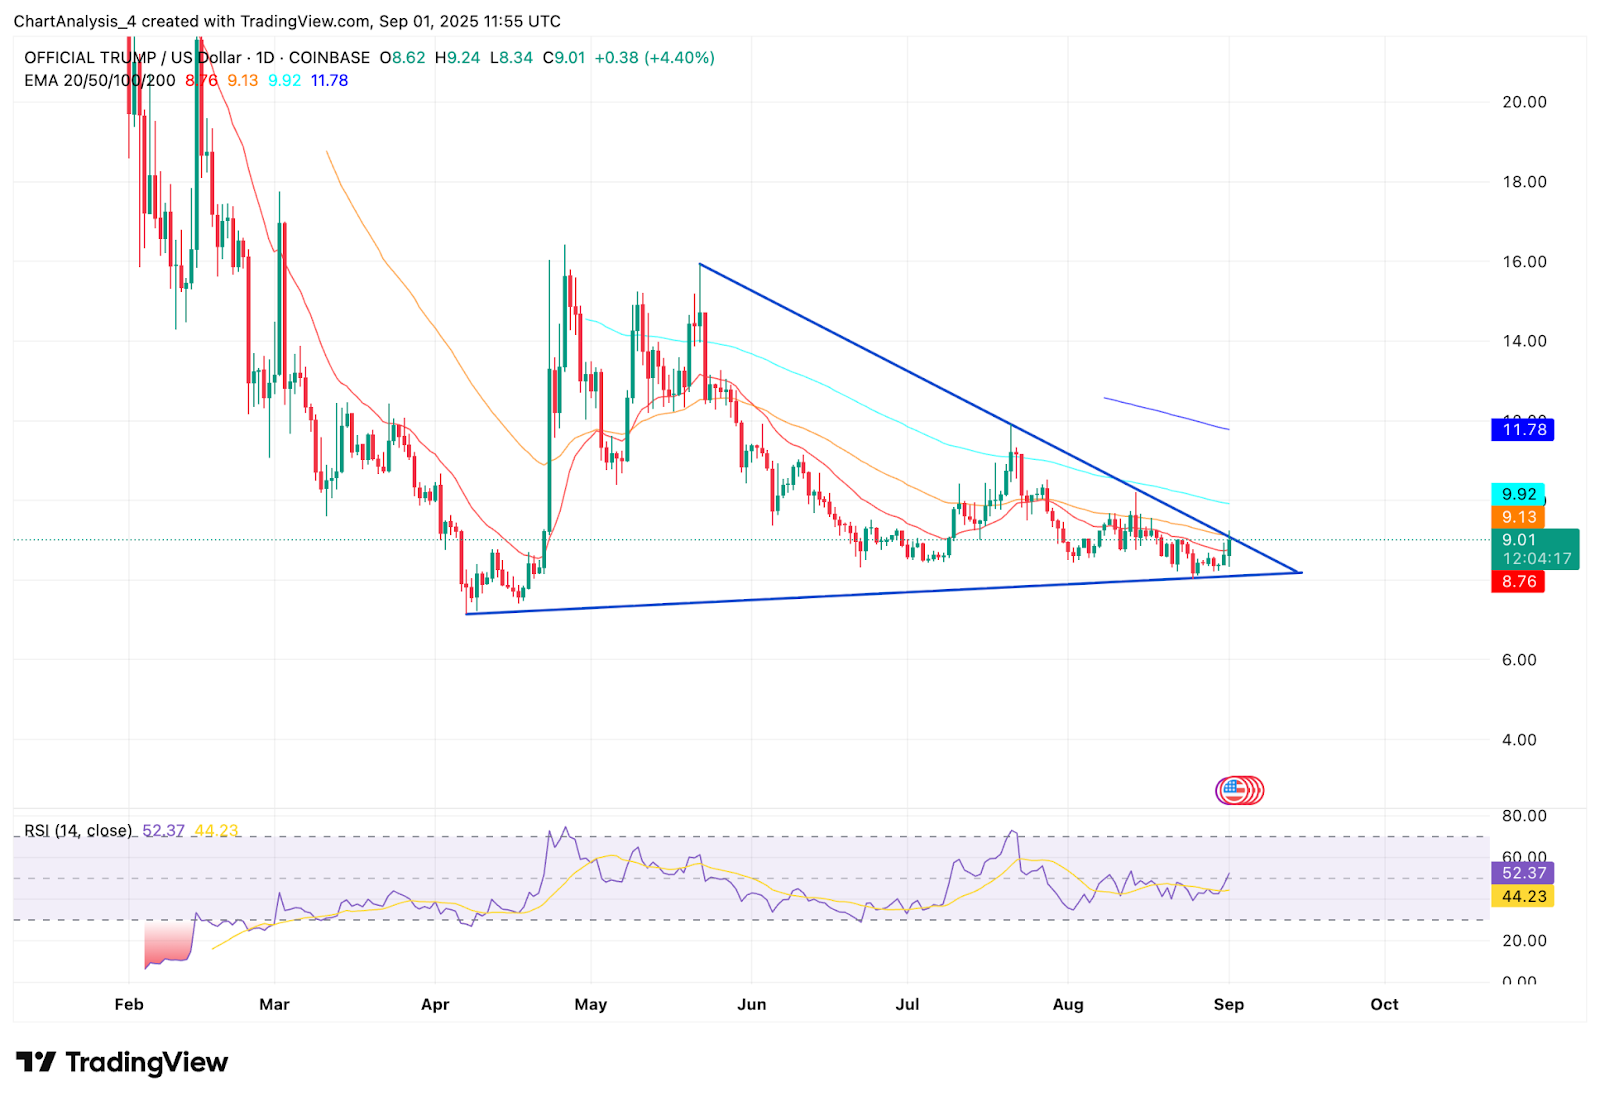
Exponential moving averages highlight TRUMP’s neutral stance. The 20-day EMA sits close to $8.76, the 50-day near $9.13, and the 100-day at $9.92. The clustering of these averages around current price underlines ongoing indecision.
Meanwhile, RSI at 52 suggests balance between buyers and sellers, though leaning slightly toward bullish momentum.
Related : Cardano (ADA) Price Prediction for September 2
Supertrend and DMI Show Limited Momentum
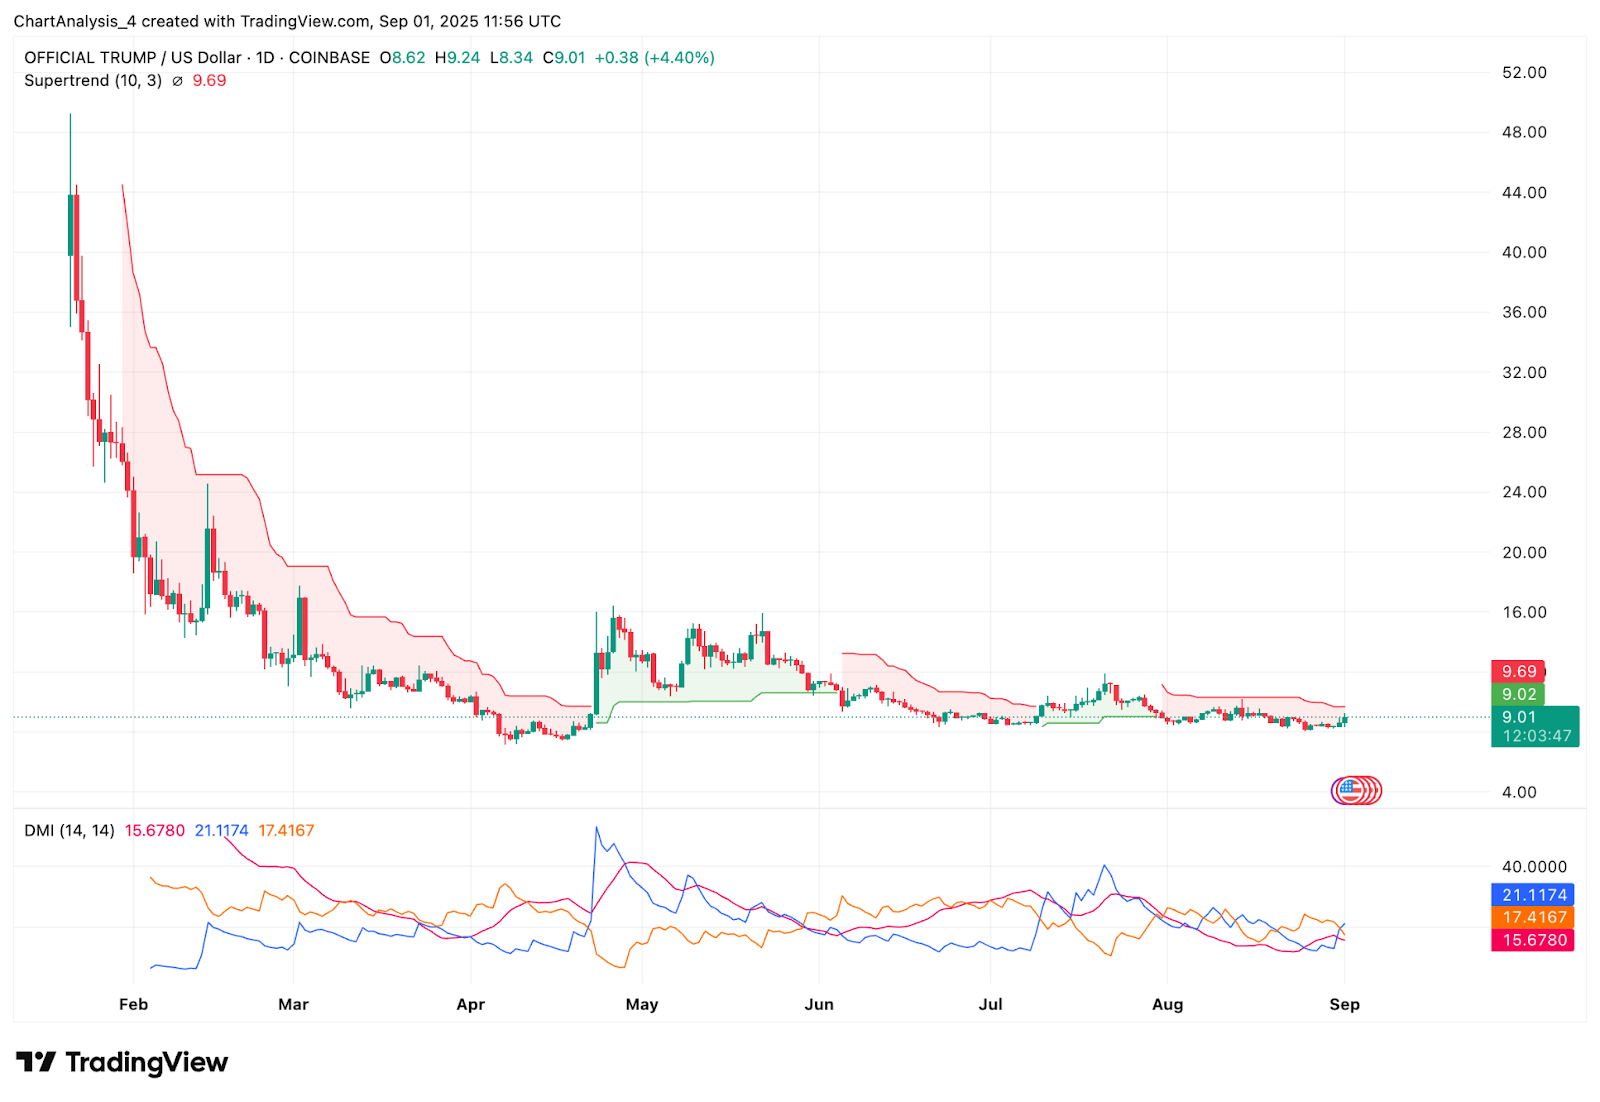
The Supertrend indicator remains bearish, printing resistance around $9.69. Until TRUMP clears that level, buyers face overhead pressure.
Directional Movement Index (DMI) values show ADX weak near 17, reflecting limited momentum. The +DI line (21.1) above the -DI (15.6) points to modest bullish advantage, though conviction remains low.
What to Expect From Official Trump Price This Month
If TRUMP closes above $9.30, it could open the way toward the 100-day EMA at $9.92 and then the longer-term 200-day EMA at $11.78. However, a failure to hold $8.70 may trigger downside retests of $8.20 and $7.80, where prior buyers re-emerged earlier in the summer.
Related: Ethereum (ETH) Price Prediction and Analysis for September 2
Can Official Trump Price Hit $12 This Month?
A run toward $12 is possible but requires a strong breakout. TRUMP needs a close above $10.00 to confirm a bullish shift, with momentum likely accelerating toward the $11.50–$12.00 zone. Without this confirmation, sideways consolidation is more probable.
Conclusion
The Official Trump price prediction for September 2025 shows a market in balance, with $8.70 as key support and $9.30 as near-term resistance. Indicators remain neutral, leaving September poised for either a breakout toward $12 or renewed weakness toward $8.20. Traders should watch the $9.30–$10.00 range closely, as it may define the month’s direction.
Related: XRP Price Prediction: XRP Struggles Against Descending Resistance
Disclaimer: The information presented in this article is for informational and educational purposes only. The article does not constitute financial advice or advice of any kind. Coin Edition is not responsible for any losses incurred as a result of the utilization of content, products, or services mentioned. Readers are advised to exercise caution before taking any action related to the company.
 Price Prediction: Can Bulls Sustain the $0.045 Push?")


