
- OKB rebounds from $60 demand zone as price challenges 100 and 200 day averages now
- Derivatives open interest cooled after 2025 liquidations, signaling cautious leverage
- ICE minority stake in OKX strengthens sentiment and boosts OKB ecosystem outlook
The price of OKB has drawn renewed attention after a strong rebound from its February lows. The token trades against USDT on the daily chart and shows signs of short-term recovery momentum. However, the broader structure still reflects a longer bearish phase that started in October.
Consequently, traders now watch whether the current bounce evolves into a sustained trend reversal. The move also follows fresh institutional interest in the exchange behind the token, which has strengthened market sentiment around the asset.
Short-Term Recovery Challenges Long Downtrend
Since October, OKB has followed a clear downward structure marked by lower highs and lower lows. The token declined sharply from about $230 to near $60. That fall defined the dominant bearish trend for several months.
However, February marked an important turning point. Price rebounded strongly from the $60 demand zone. Consequently, the market reclaimed the 20-day and 50-day exponential moving averages. This shift suggests improving short-term momentum.
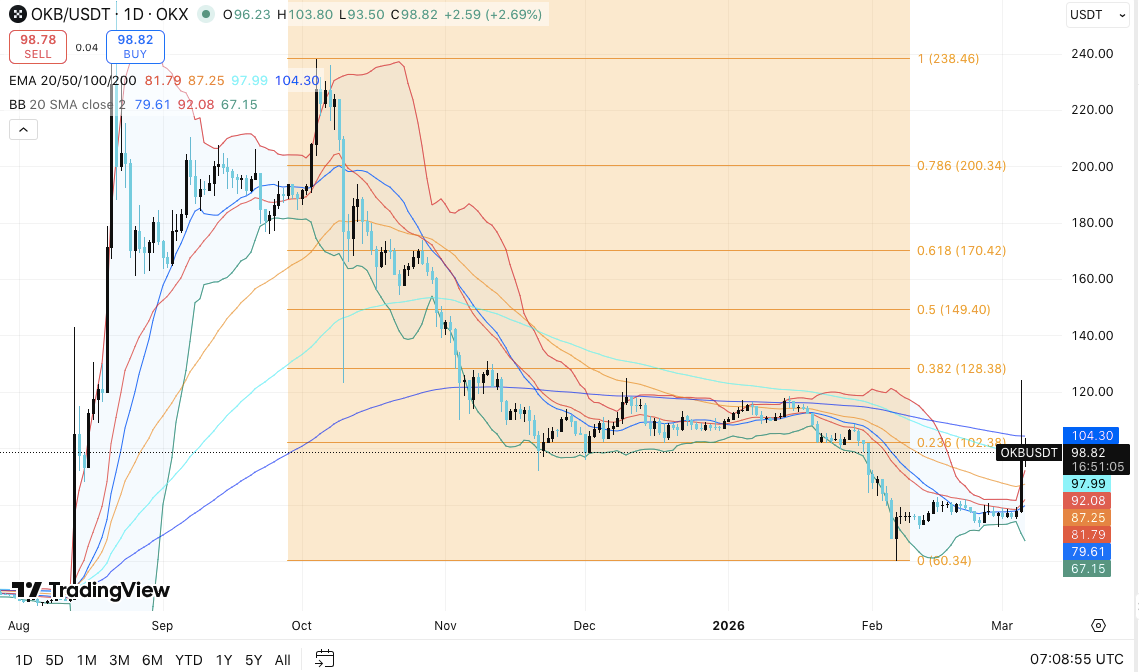
Currently, OKB approaches the 100-day average near $98. Moreover, the 200-day average sits around $104 and forms a major resistance zone. A sustained move above these levels could strengthen bullish momentum.
Related: Solana Price Prediction: Bulls Eye $90 Breakout as ETFs Hold $1.5B Inflows
Bollinger Bands also support the recovery narrative. Price now trades above the middle band near $92. Hence, buyers currently maintain short-term control.
Despite this progress, the larger trend remains uncertain. The market must break higher resistance levels before confirming a structural reversal.
Derivatives Data Shows Cooling Speculation
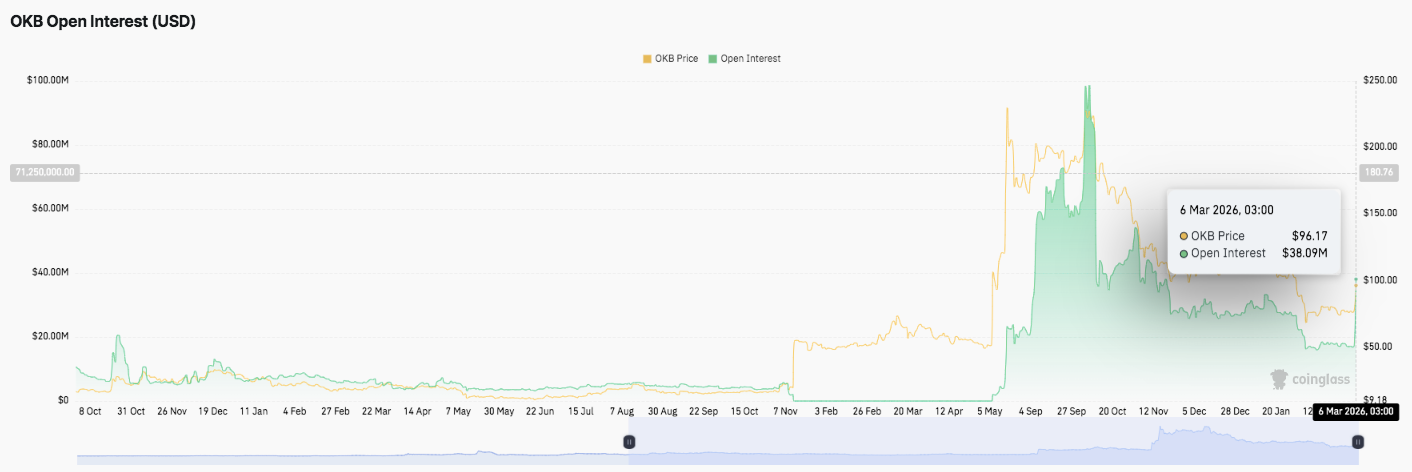
Open interest data reveals how trader participation evolved during the previous cycle. Throughout late 2024, derivatives exposure remained relatively low and stable. Most activity stayed below $20 million while price moved gradually.
However, speculation expanded significantly during 2025. From May onward, open interest climbed alongside rising prices. The metric eventually surged near $100 million in September as OKB traded above $200.
That surge signaled heavy leveraged participation. Consequently, the subsequent price drop triggered rapid liquidations and position closures. Since late 2025, open interest stabilized between $20 million and $40 million. Moreover, the reduced leverage suggests traders now approach the market more cautiously.
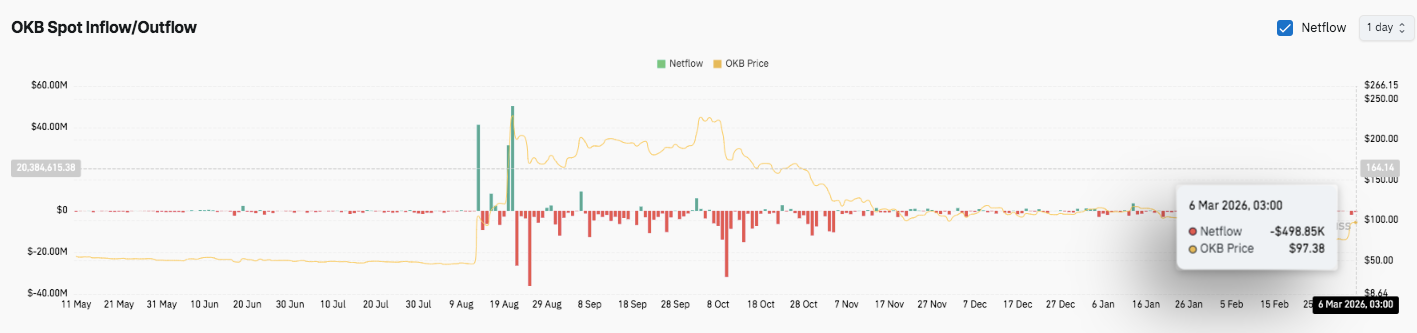
Spot flows also highlight shifting sentiment. Early activity remained relatively neutral until August. Then large inflows exceeding $40 million appeared as price rallied sharply.
Soon after, strong outflows followed as traders secured profits. Through late 2025 and early 2026, flows returned closer to neutral levels. This balance indicates consolidation rather than aggressive accumulation.
Institutional Tie-Up Adds Fundamental Momentum
Besides technical developments, institutional news recently boosted attention toward the ecosystem. Intercontinental Exchange reportedly acquired a minority stake in OKX. The deal values the exchange near $25 billion.
The investment also grants ICE a board seat. Additionally, the partnership expands collaboration between traditional finance and crypto markets.
Under the agreement, ICE will license real-time spot pricing data from OKX. Moreover, OKX plans to introduce tokenized equities linked to stocks listed on the New York Stock Exchange.
The exchange targets a potential rollout during the second half of 2026, pending regulatory approval. Significantly, these developments could strengthen market confidence around OKB.
Technical Outlook for OKB Price
Key levels remain well-defined as OKB heads into March.
Immediate upside hurdles are $102, $105, and $108. A successful breakout above these levels could extend toward $128 and $149.
On the downside, trendline support sits at $92, followed by $87 and $81. The 200-day EMA near $104 acts as a crucial resistance ceiling. Flipping this level could provide medium-term bullish momentum.
Related: Cardano Price Prediction: Bulls Test Channel Resistance as ADA Enters Swiss Retail Payments
The technical picture shows OKB consolidating after its February bottom near $60. Price has reclaimed the EMA20 and EMA50, but still faces a larger downtrend. A decisive move above $105–$108 could trigger stronger momentum and higher volatility. Conversely, failure to defend $92 risks a pullback toward $87 and the longer-term support near $81.
Will OKB Rally?
OKB’s short-term trajectory depends on whether buyers can hold above $92 and challenge the $102–$105 cluster. Technical compression around current levels, combined with stable spot flows, points to potential volatility ahead.
If bullish momentum strengthens, OKB could test $128 and possibly $149–$170, aligning with Fibonacci retracement targets from the October–February swing. On the other hand, losing $92 could signal a short-term pullback and increased pressure toward $87 or $81.
For now, OKB remains in a critical zone. Traders should watch both inflows and price behavior around EMA200 and $105 resistance. These factors will determine whether the relief rally evolves into a sustained bullish trend or remains a temporary recovery.
Disclaimer: The information presented in this article is for informational and educational purposes only. The article does not constitute financial advice or advice of any kind. Coin Edition is not responsible for any losses incurred as a result of the utilization of content, products, or services mentioned. Readers are advised to exercise caution before taking any action related to the company.
 Price Prediction: Canton Eyes Key Break After Market Activity Spike")


