
- Binance whale inflows have dropped by more than $3B, suggesting reduced selling pressure.
- A potential recovery can take months, according to analyst Kripto Mevsimi.
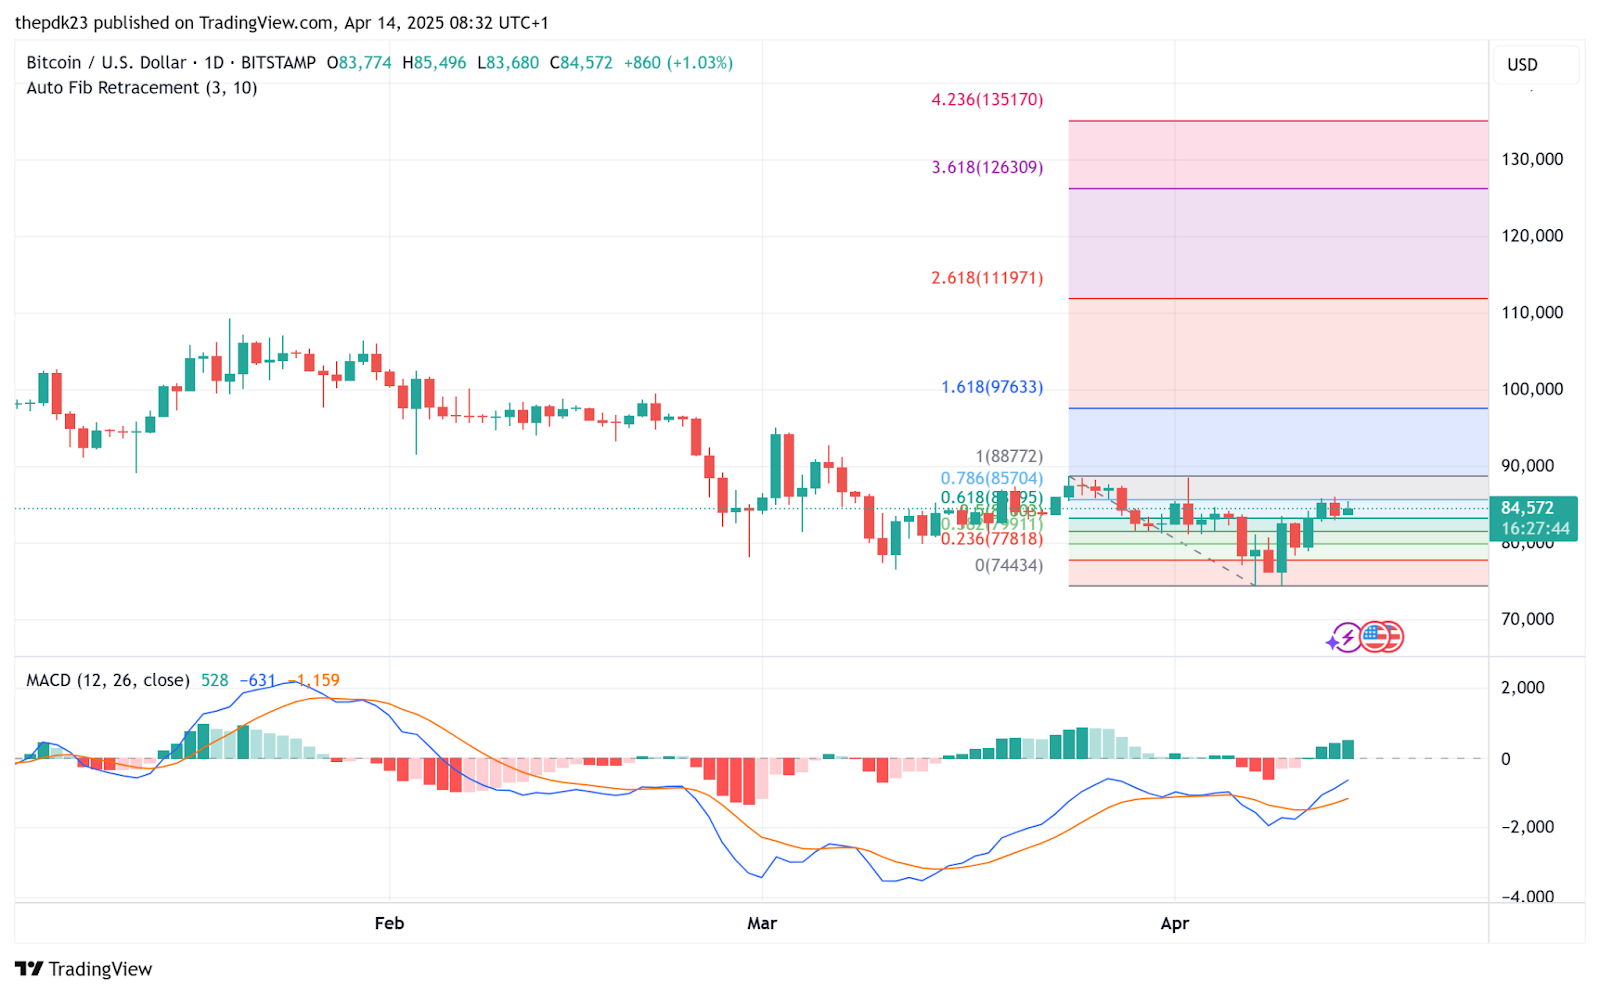
- Immediate support levels for BTC stand at $83,195 (0.618 Fib) and $85,704 (0.786 Fib).
Bitcoin is finding stability around the $84,500 mark after a lengthy corrective phase. With whale behavior stabilizing, a major institutional long bet hitting the market, and key technical indicators shifting to bullish, sentiment is slowly turning positive for investors.
Notably, as per analyst Darkfost, the recent on-chain data from Binance reveals that large holders or whales are not exhibiting panic-driven behavior.
On-Chain View: Whale Behavior Signals Less Selling Pressure
Darkfost noted that the 365-day moving average of the Exchange Whale Ratio is on a consistent upward trend.
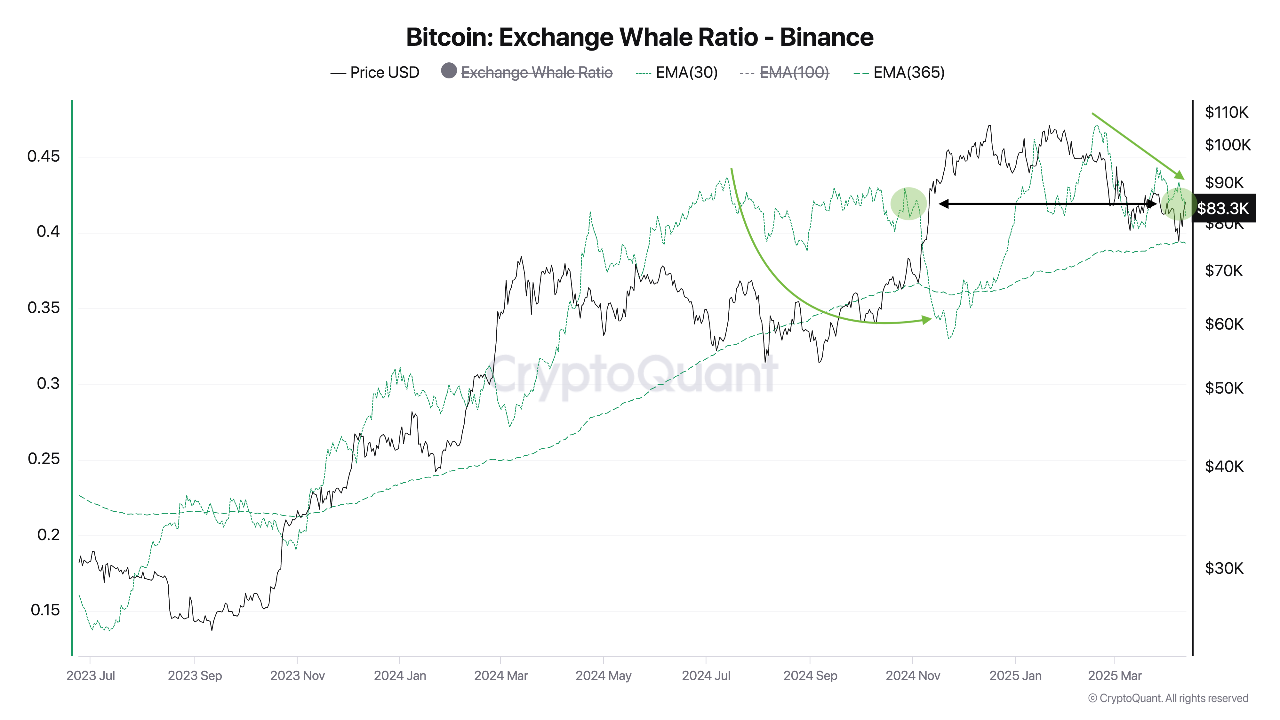
This implies whales exert more influence on Binance fund flows over longer periods, hinting at underlying conviction.
However, the 30-day average of the same metric has been decreasing, returning to levels last seen in late 2024. This short-term decline in activity likely indicates that these big players are pulling back on selling pressure.
Backing this, total whale inflows into Binance have dropped by more than $3 billion, a move that echoes behavior seen during previous corrections.
Related: ‘Fed on the Clock’: Hayes Links Bond Market Stress to Coming Bitcoin Gains
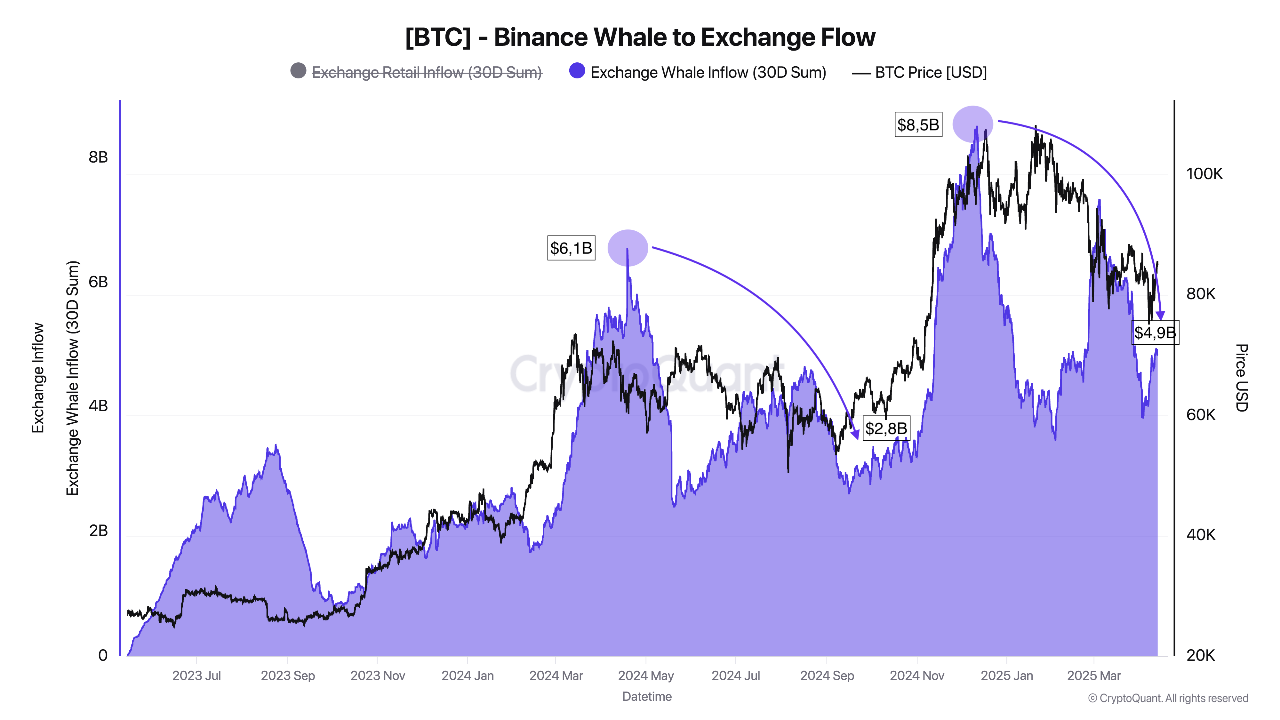
Overall, this trend indicates that whales are not currently rushing for the exits. Instead, they’re likely choosing to sit tight and avoid major sell-offs.
Caution Advised: History Shows Recoveries Can Take Time
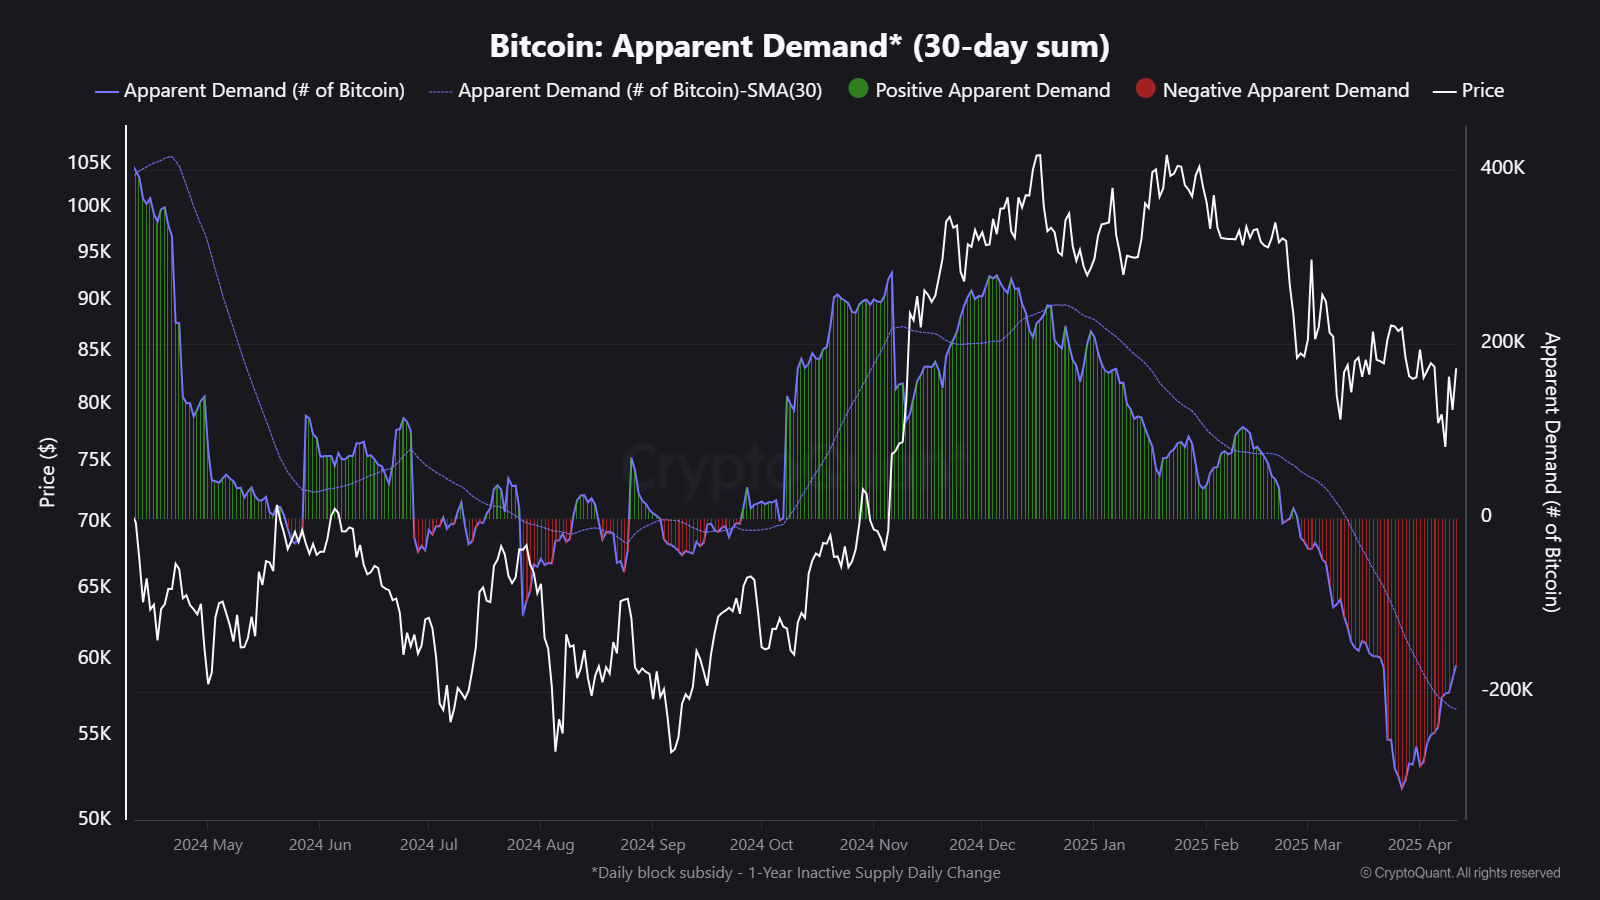
Despite the improved technical and on-chain picture, some analysts urge patience. As per analyst Kripto Mevsimi, historical patterns, particularly from the 2021 cycle, show that even when metrics like demand or price start to bounce, a true structural recovery can take months.
During previous cycles, demand metrics stayed negative or near zero for extended periods before any sustainable bullish trend took hold.
While Bitcoin’s recent 30-day apparent demand shows a bounce, it might reflect temporary relief, not confirmed accumulation or a definitive bottom. Sustained buying volume and time are still needed to confirm a full market turn.
Technical Setup Offers Constructive Short-Term Picture
Bitcoin’s daily chart currently aligns with cautious optimism. The Fibonacci retracement plotted from the local bottom of $74,434 to the top at $88,772 shows that Bitcoin has reclaimed key levels.
BTC is currently trading above the 0.618 level ($83,195) and testing the 0.786 level ($85,704). The prior high of $88,772 remains the immediate major resistance.
Related: North Carolina’s ‘Digital Asset Freedom Act’ Looks More Like a Bitcoin Bill
Should price break through $88,772, the next major target is the 1.618 Fibonacci extension at $97,633, followed by possible moves to $111,971, $126,309, and even $135,170 in a sustained uptrend.
Momentum indicators like the MACD also support a bullish outlook. The MACD line has recently crossed above the signal line, and histogram bars are climbing into positive territory. This is a classic signal that buyers are regaining control.
Disclaimer: The information presented in this article is for informational and educational purposes only. The article does not constitute financial advice or advice of any kind. Coin Edition is not responsible for any losses incurred as a result of the utilization of content, products, or services mentioned. Readers are advised to exercise caution before taking any action related to the company.


