
- A PEPE whale sold 2.2 trillion tokens at a $3.5 million loss across three Binance deposits.
- PEPE formed a bullish flag with a possible 102% upside to $0.00002051 if confirmed.
- RSI dropped to 37.65, signaling weak momentum and approaching oversold territory.
The market for the meme token PEPE is presenting a conflicting picture for traders, as significant bearish on-chain activity clashes with a potentially bullish technical chart pattern.
While a major whale has exited a multi-trillion token position at a loss, a classic continuation pattern on the daily chart suggests the potential for a significant rally.
On-Chain Data: A Major Whale Exits
According to data from on-chain tracking service Lookonchain, a large PEPE whale has exited their full 2.2 trillion token position, recording an estimated $3.5 million loss. According to Lookonchain, the wallet address 0x6ea4…FE0 deposited the final 600 billion PEPE tokens to Binance about 50 minutes ago, completing a month-long sequence of returns to the exchange.
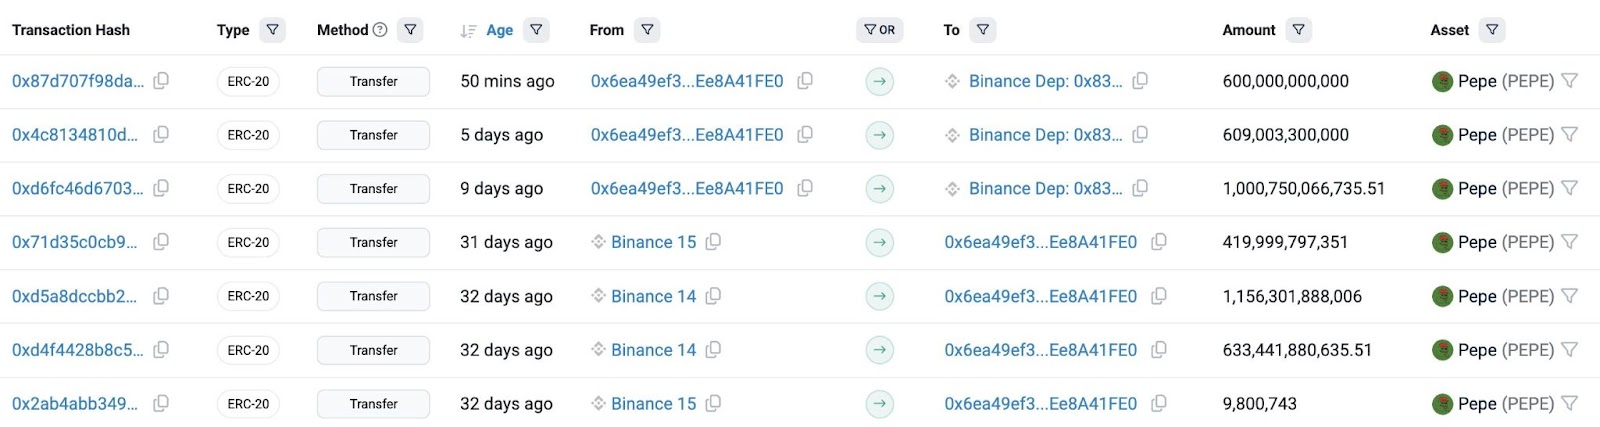
On-chain data confirms the whale had withdrawn 2.2 trillion PEPE from Binance in mid-May. Over the past ten days, they returned those tokens in three separate deposits—first on June 8, then on June 13, and finally on June 18. The final batch, worth $6.04 million, marked the end of the whale’s position.
The withdrawal a month ago was valued at $27.64 million. By the time the whale completed the return, token prices had dropped enough to realize a $3.5 million loss. Each batch went to the same Binance deposit address. The image data shows all related transactions: the wallet received over 1.1 trillion PEPE from Binance 14 on May 17, added 633 billion more the next day, and continued to accumulate until holding 2.2 trillion tokens.
This reversal appears to be a full-scale exit. The whale took the loss and sent the entire stack back to the same platform it came from. The move highlights a drop in whale confidence and adds pressure to the PEPE price. When such large holders offload tokens to exchanges, it often signals a bearish short-term trend. The market now watches whether similar wallets follow the same path.
PEPE Forms Bullish Flag With 102% Upside Potential
On June 18, 2025, PEPE/USDT on Binance formed a bullish flag pattern on the 1-day chart. A bullish flag pattern is a continuation structure where the price consolidates downward between two parallel trendlines after a sharp upward move, indicating potential for another rally once the pattern breaks.

In this case, PEPE surged in early May 2025 and has since retraced within a tight downward-sloping channel. The flagpole—the sharp upward leg—preceded the current consolidation. The consolidation structure remains intact and has not broken out yet, but the pattern remains valid.
If PEPE confirms a breakout above the upper red trendline, it could resume its previous rally. Based on the height of the flagpole and the breakout projection, the target sits around $0.00002051. From the current price of $0.00001010, that marks a 102% potential upside.
The 50-day Exponential Moving Average (EMA), currently at $0.00001137, acts as the first resistance. If PEPE reclaims this level, it would further support the bullish breakout case. Volume remains high, recorded at 5.1 trillion PEPE on the day of analysis, showing that liquidity exists to support a breakout.
PEPE RSI Near Oversold Zone as Momentum Weakens
Meanwhile, the Relative Strength Index (RSI) for PEPE/USDT on the 1-day chart dropped to 37.65, according to TradingView. The RSI measures the strength and speed of price movements over a 14-day period and helps identify whether an asset is overbought or oversold. An RSI below 30 signals oversold conditions, while readings above 70 suggest overbought momentum.
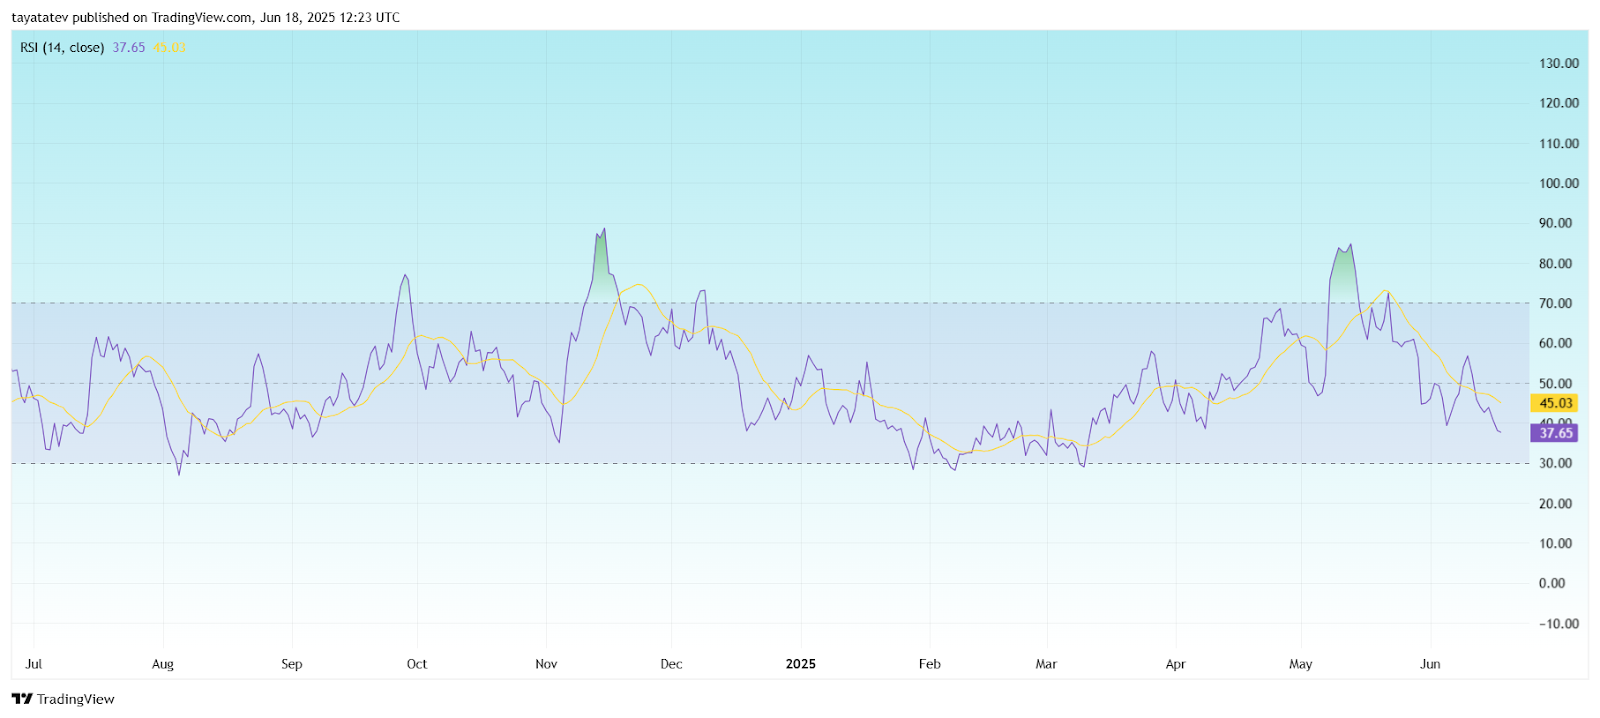
Currently, PEPE’s RSI sits just above the oversold threshold, indicating weakening buying pressure. The yellow signal line, which smooths out short-term fluctuations, stands at 45.03 and remains above the RSI line. This crossover shows bearish divergence, meaning the recent downtrend may continue unless momentum reverses.
Throughout the past year, PEPE’s RSI fluctuated between 30 and 70, rarely entering extreme zones. The last time it approached current levels was during consolidation phases, followed by strong rallies. However, this time, the RSI trend points downward, reflecting reduced demand.
If RSI drops further toward 30, the token could enter an oversold zone, which sometimes precedes a bounce. Until then, PEPE remains in a weak momentum phase, with limited signs of recovery in this indicator.
Disclaimer: The information presented in this article is for informational and educational purposes only. The article does not constitute financial advice or advice of any kind. Coin Edition is not responsible for any losses incurred as a result of the utilization of content, products, or services mentioned. Readers are advised to exercise caution before taking any action related to the company.


