


- PEPE token shows strong bullish signals, with a 5.5% increase and a target price of $0.00000919.
- The token’s market cap rose to $2.885 billion alongside a 14.62% spike in trading volume.
- Indicators suggest bullish momentum but caution over potential overbought conditions.
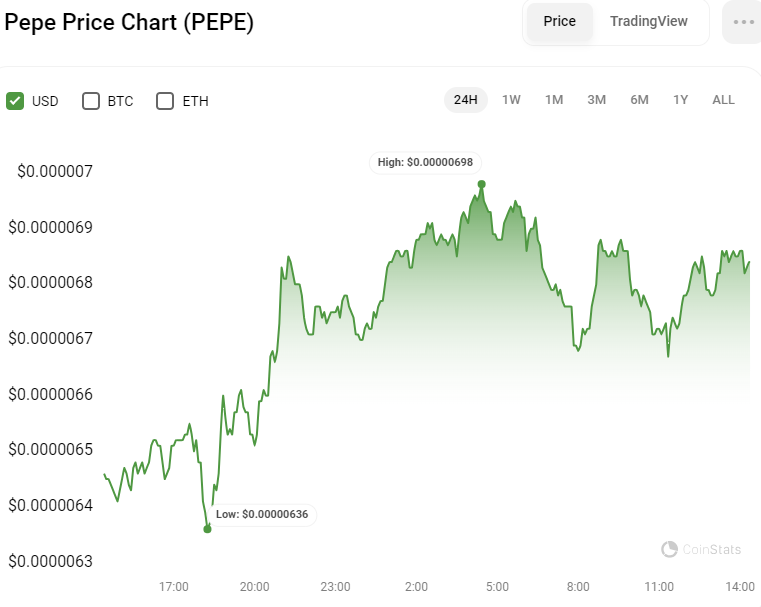
Pepe’s PEPE token has experienced a bullish trend over the last 24 hours, with prices ranging between $0.00000636 and $0.00000698, according to CoinStats data. The lower end of this range has served as a support level, while the upper end has acted as resistance to the token’s price movements. As of press time, the PEPE token is trading at $0.00000682, marking a 5.5% increase from the previous day.
This positive momentum has also been reflected in the token’s market capitalization, which has risen by 6.57% to reach approximately $2.885 billion. Additionally, the trading volume has seen a boost, up 14.62% in the last 24 hours, totaling $1.018 billion. This increase indicates a heightened interest and activity in trading the PEPE token.
PEPE/USD Price Action
The PEPE token is demonstrating an upward trend on the one-day chart, heading towards the 61.8% Fibonacci retracement level, with the potential to surpass this marker and challenge the overhead resistance. At the moment, the price is experiencing slight stagnation around the 50% Fibonacci level, indicating a pause in the bullish momentum.

If this bullish trend persists, it is expected that PEPE will breach the 61.8% level and potentially test the resistance zone above. Such a breakthrough could propel the token’s value to new heights, specifically targeting the $0.00000919 price point.
Conversely, should the bears regain market control, a retest of the 50% Fibonacci level or even a dip to the immediate support level below could occur. This scenario would provide traders with an opportunity to reassess and potentially reposition their stakes in anticipation of a bullish breakout.
Indicators Point to Continued Growth
On the technical analysis front, the Moving Average Convergence Divergence (MACD) indicator offers a bullish signal, positioned slightly above the signal line at 0.00000385. This setup indicates an accumulation of bullish momentum in the short term. Supporting this optimistic outlook, the MACD’s histogram bars are increasingly green and growing in size, further reinforcing the strengthening bullish trend.

Additionally, the Chaikin Money Flow (CMF) index aligns with this positive sentiment, trading above the zero line at a value of 21. This indicates a net inflow of money into the PEPE market, suggesting potential for further price appreciation. However, the proximity of the CMF to the 20 mark warrants caution, as it hints at possible overbought conditions. This could precipitate a short-term correction or price pullback before the upward trajectory resumes, offering a point for investors to consider their positions in the market.
Disclaimer: The information presented in this article is for informational and educational purposes only. The article does not constitute financial advice or advice of any kind. Coin Edition is not responsible for any losses incurred as a result of the utilization of content, products, or services mentioned. Readers are advised to exercise caution before taking any action related to the company.


