 Price Prediction for June 30, 2025: Can PI Reclaim $0.55 After Repeated Rejections?")
Pi coin is consolidating below a key resistance level after a series of intraday recovery attempts failed to hold above the $0.55 mark. As of writing, the Pi coin price today is $0.532, down 0.17% on the day, reflecting a cautious tone among bulls amid low momentum. The short-term price action shows compression between $0.527 and $0.548, with traders eyeing a breakout from this narrowing structure.
What’s Happening With Pi Coin’s Price?
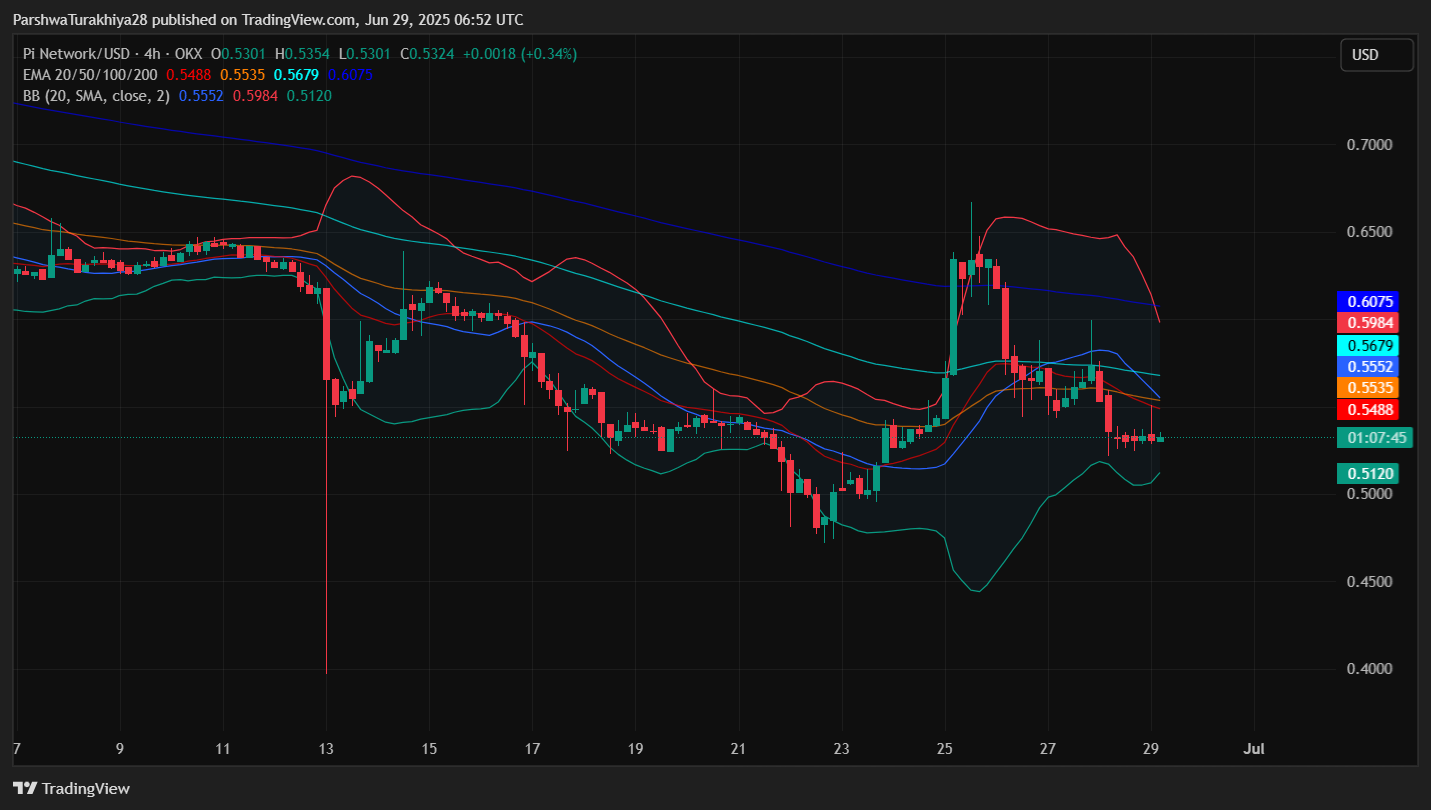
The 4-hour chart reflects a steady decline from the recent local high near $0.653, where the Pi coin price action encountered strong selling interest. Price remains below the 20, 50, 100, and 200 EMA cluster, with the 200 EMA capping upside at $0.607 and the 20 EMA holding at $0.548. This bearish EMA alignment indicates sustained downward bias, unless a breakout reclaims the mid-range near $0.567.
Current price action is compressed inside the lower Bollinger Band on the 4-hour timeframe, with the lower band at $0.512 acting as a critical near-term floor. Price has respected this level twice in the past 48 hours, hinting at a potential base. However, upper band rejections near $0.598 have proven difficult to overcome, reinforcing the resistance bias near $0.55–$0.56.
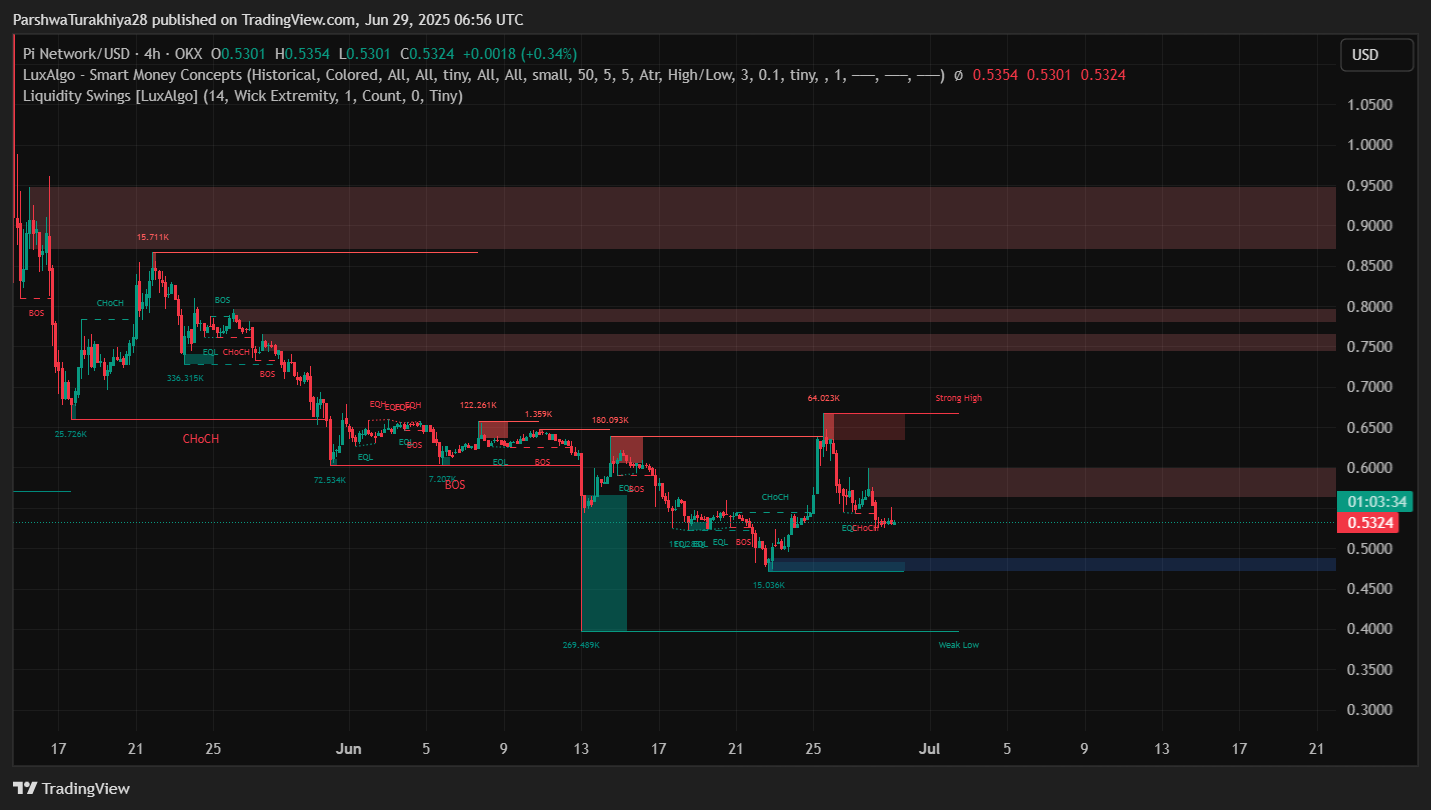
From a Smart Money perspective, liquidity data from the 4-hour chart shows a large imbalance near $0.505, while price has been repeatedly rejecting the EQ zone around $0.555–$0.560. This aligns with a previously established CHoCH zone and suggests that further upside will require substantial volume-driven confirmation.
Why Is the Pi Coin Price Going Down Today?
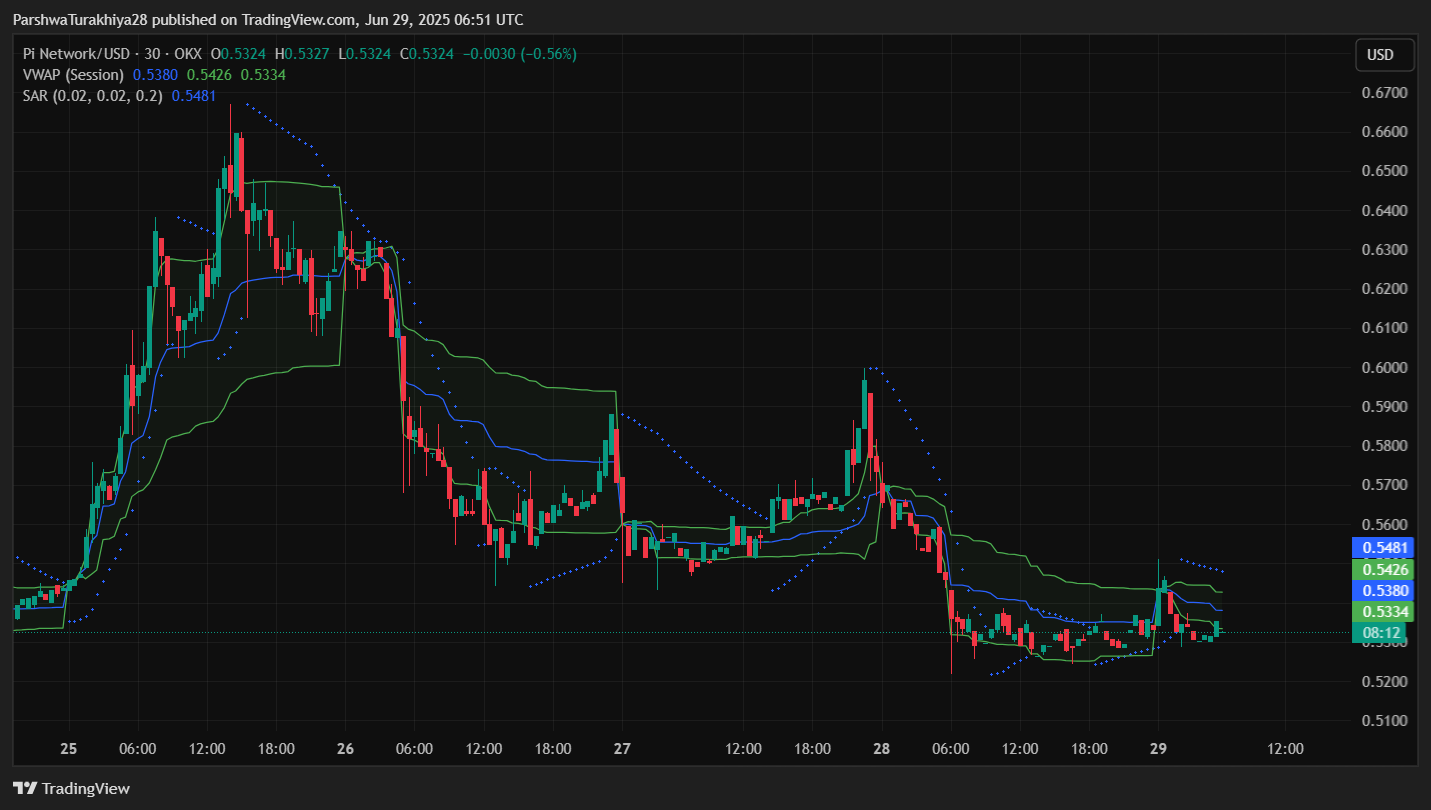
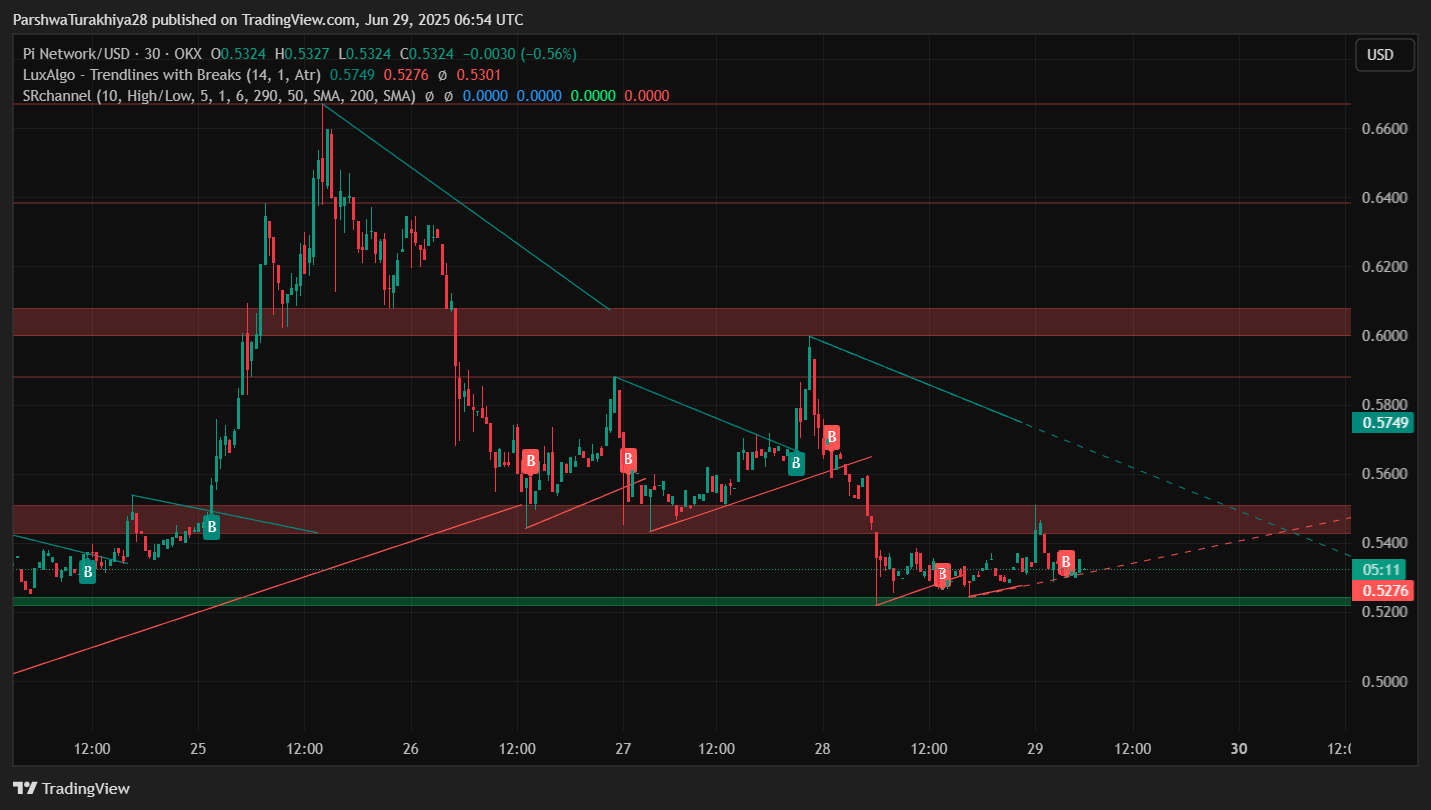
A combination of bearish technical factors continues to weigh on Pi coin price performance. The 30-minute chart reveals a descending channel structure with repeated trendline rejections, while Parabolic SAR dots remain above price, indicating active selling momentum. VWAP currently sits at $0.538 and has flipped into resistance, keeping the pair under intraday pressure.
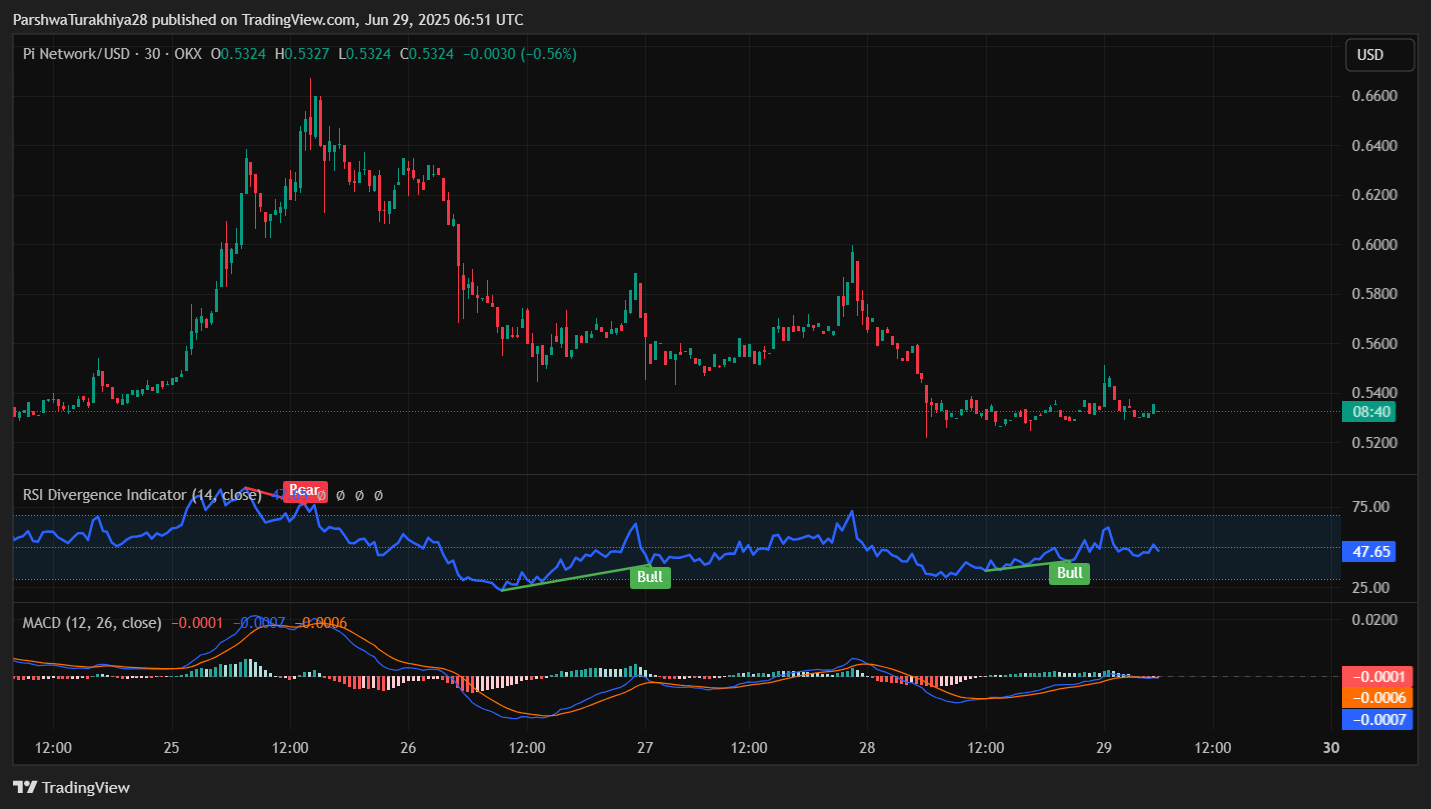
Moreover, the MACD on the 30-minute chart remains below the signal line, showing weak bullish crossover attempts that fail to hold. The RSI, while climbing to 47.6 from oversold levels, remains below the neutral 50 mark, suggesting any upside is still fragile. Divergences are forming, but momentum has yet to follow through.
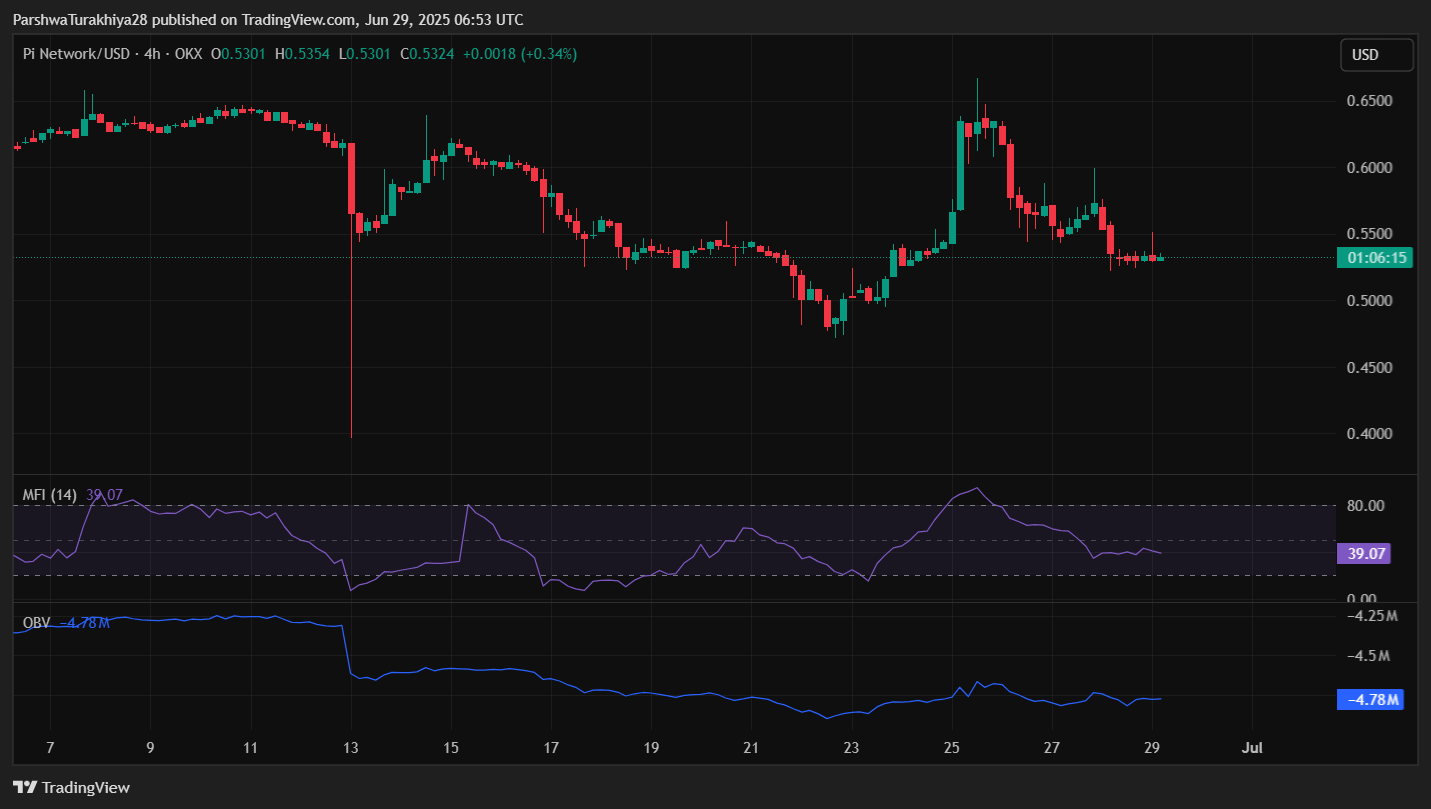
On-chain momentum also echoes caution. The Money Flow Index (MFI) on the 4-hour chart is at 39.07, signaling continued capital outflows, while OBV remains stuck near -4.78M, confirming a lack of strong buyer accumulation.
Additionally, Smart Money CHoCH (Change of Character) and BOS (Break of Structure) signals confirm that sellers have continued to dominate order flow below $0.555. Liquidity sweeps on both ends have failed to trigger any meaningful trend shift, further confirming the indecision.
Key Indicators Signal Compression and Volatility Ahead
The RSI divergence on the 30-minute chart recently flipped from a bearish rejection to a possible bullish divergence, though confirmation is lacking. Until the RSI can reclaim 50 and hold above, it may simply signal range expansion without conviction.
Meanwhile, price action is caught between the VWAP ($0.538) and support trendline at $0.527, forming a wedge-like structure with tightening range. This is supported by narrowing Bollinger Bands, which point to an incoming volatility expansion.
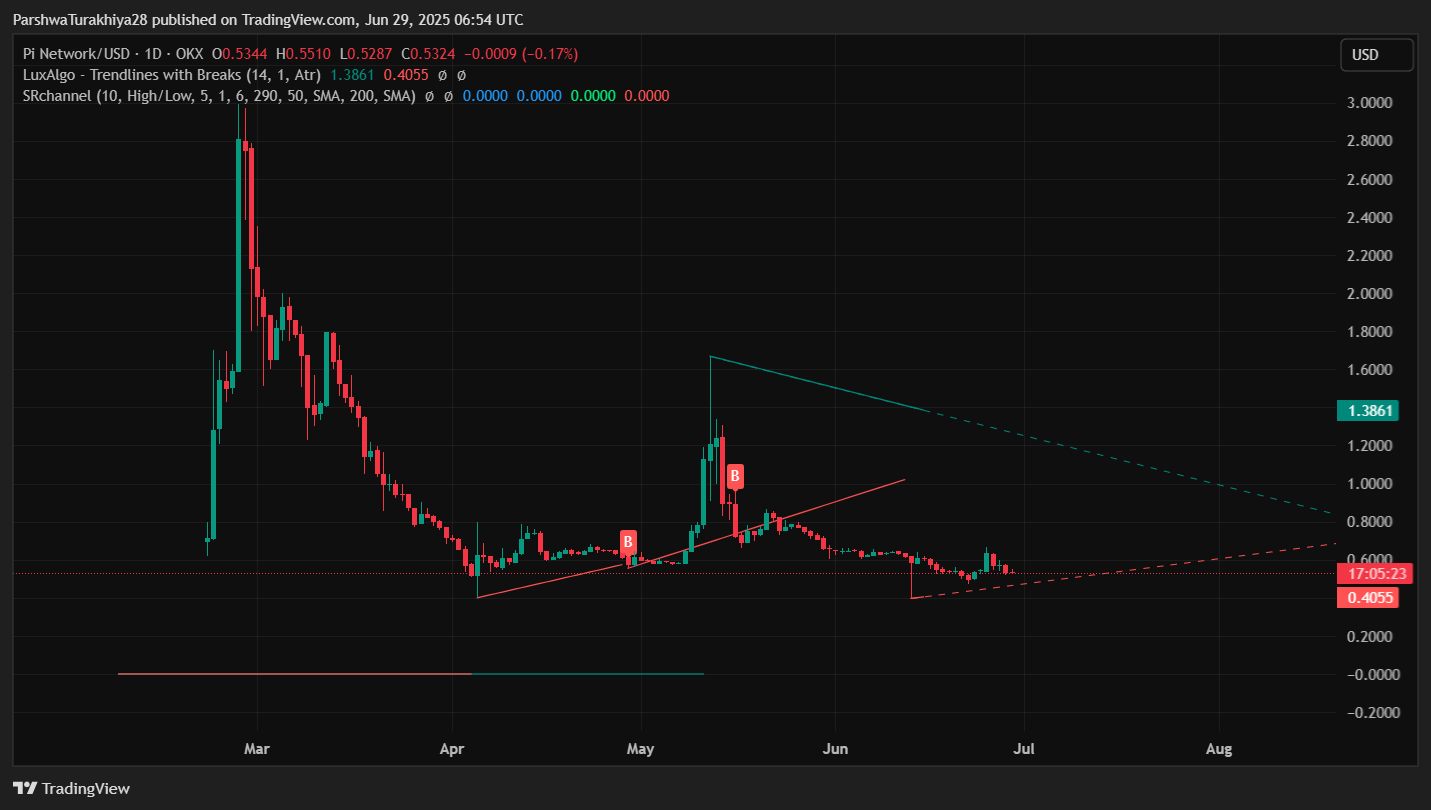
The 4-hour and daily charts also show converging trendlines pointing toward a mid-term apex around July 3–5. A decisive move is likely to emerge from this coiling range, but the direction depends on whether buyers can flip the $0.548–$0.555 supply zone.
PI Price Prediction: Short-Term Outlook (24h)
If the Pi coin price manages to close above the VWAP and $0.538–$0.548 resistance cluster with convincing volume, the next short-term target lies at $0.567 (EMA100). A sustained breakout above that could reopen upside toward $0.598 and eventually $0.607, where the 200 EMA lies.
On the downside, a breakdown below $0.527 will likely test $0.512, the lower Bollinger Band and current base structure. A clean break below $0.512 risks acceleration toward the order block at $0.5019, followed by the smart money support at $0.475.
Overall, Pi coin price volatility remains elevated within a tightening wedge. With multiple indicators showing neutral to bearish conditions and volume stagnating, traders should prepare for a possible sharp move as compression nears resolution.
Pi Coin Price Forecast Table: June 30, 2025
| Indicator/Zone | Level (USD) | Signal |
| Resistance 1 | 0.548 | VWAP and EMA20 ceiling |
| Resistance 2 | 0.567 | EMA100 zone |
| Support 1 | 0.527 | Trendline and lower range base |
| Support 2 | 0.512 | Bollinger Band bottom |
| RSI (30-min) | 47.65 | Slight bullish divergence |
| MACD (30-min) | Below zero | Weak momentum |
| VWAP | 0.538 | Acting as resistance |
| Parabolic SAR | 0.5481 (above) | Bearish signal |
| MFI (4H) | 39.07 | Weak inflows |
| OBV | -4.78M | No clear accumulation yet |
| Smart Money Zone | 0.5019 | Demand block |
Disclaimer: The information presented in this article is for informational and educational purposes only. The article does not constitute financial advice or advice of any kind. Coin Edition is not responsible for any losses incurred as a result of the utilization of content, products, or services mentioned. Readers are advised to exercise caution before taking any action related to the company.


