 Price Prediction 2025-2030: Market Trends, Growth Potential, and Future Forecast")
- Pi Network’s price is expected to range between $0.86 and $2.70 in 2025, with $1.50 as the estimated average value.
- A breakout above $1.65 could push the price toward $2.00, while failure to hold $1.33 support may result in a decline toward $1.05.
- Strong market adoption and exchange listings could drive bullish momentum, but sell-offs and corrections may test major support at $0.86 before recovery.
Pi Network is a cryptocurrency project that aims to make digital currency mining accessible to a broader audience by enabling users to mine Pi coins directly from their mobile devices. Launched in 2019 by a team of Stanford University graduates, Pi Network seeks to democratize access to cryptocurrency and foster a robust ecosystem of decentralized applications (dApps).
Table of contents
- Pi (PI) Current Market Status
- Key Features of Pi Network
- Pi (PI) Price Prediction 2025-2030 Overview
- Mainnet Launch and Market Performance
- Bollinger Bands Analysis for Pi (PI)
- MACD Analysis for Pi (PI)
- Relative Strength Index (RSI) Analysis for Pi (PI)
- Support and resistance levels for Pi (PI)
- Pi (PI) 2025 Price Prediction Analysis
- Pi (PI) Price Prediction for 2026
- Pi (PI) Price Prediction for 2027
- Pi (PI) Price Prediction for 2028
- Pi (PI) Price Prediction for 2029
- Pi (PI) Price Prediction for 2030
- FAQs
Pi (PI) Current Market Status
| Name | Pi |
| Symbol | PI |
| Rank | #3148 |
| Price | $1.59 |
| Price Change (24h) | 117.67% (1d) |
| Price Change (7d) | -5.72% (7d) |
| Market Cap | $10.28B |
| Circulating Supply | 6.45B PI |
| Total Supply | 9.92B PI |
Key Features of Pi Network
- Mobile Mining: Unlike traditional cryptocurrencies that require energy-intensive mining rigs, Pi Network allows users to mine Pi coins through a mobile app without significant battery drain or data usage.
- Stellar Consensus Protocol (SCP): Pi Network employs SCP, which is more energy-efficient than the Proof-of-Work mechanism used by cryptocurrencies like Bitcoin.
- User-Friendly Design: The platform emphasizes simplicity, enabling individuals without technical expertise to participate in cryptocurrency mining and transactions.
Pi (PI) Price Prediction 2025-2030 Overview
| Year | Low Price ($) | Average Price ($) | High Price ($) |
| 2025 | 0.86 | 1.5 | 2.7 |
| 2026 | 1.05 | 3.4 | 5.75 |
| 2027 | 2.01 | 4.85 | 8.42 |
| 2028 | 2.86 | 6.9 | 11.8 |
| 2029 | 3.94 | 9.25 | 15.5 |
| 2030 | 5.65 | 12.6 | 18.9 |
Mainnet Launch and Market Performance
On February 20, 2025, Pi Network transitioned from its testnet to the open mainnet, marking a significant milestone. The launch included one of the largest airdrops in crypto history, distributing Pi coins to its extensive user base. Upon listing on major exchanges such as OKX, Gate.io, Bitget, and CoinDCX, Pi coin’s price experienced high volatility. It debuted at $2.10, then plummeted over 70% within 24 hours, reaching a low of $0.737. As of February 24, 2025, the price has rebounded to approximately $1.60, with a market capitalization of around $8.6 billion.
Bollinger Bands Analysis for Pi (PI)
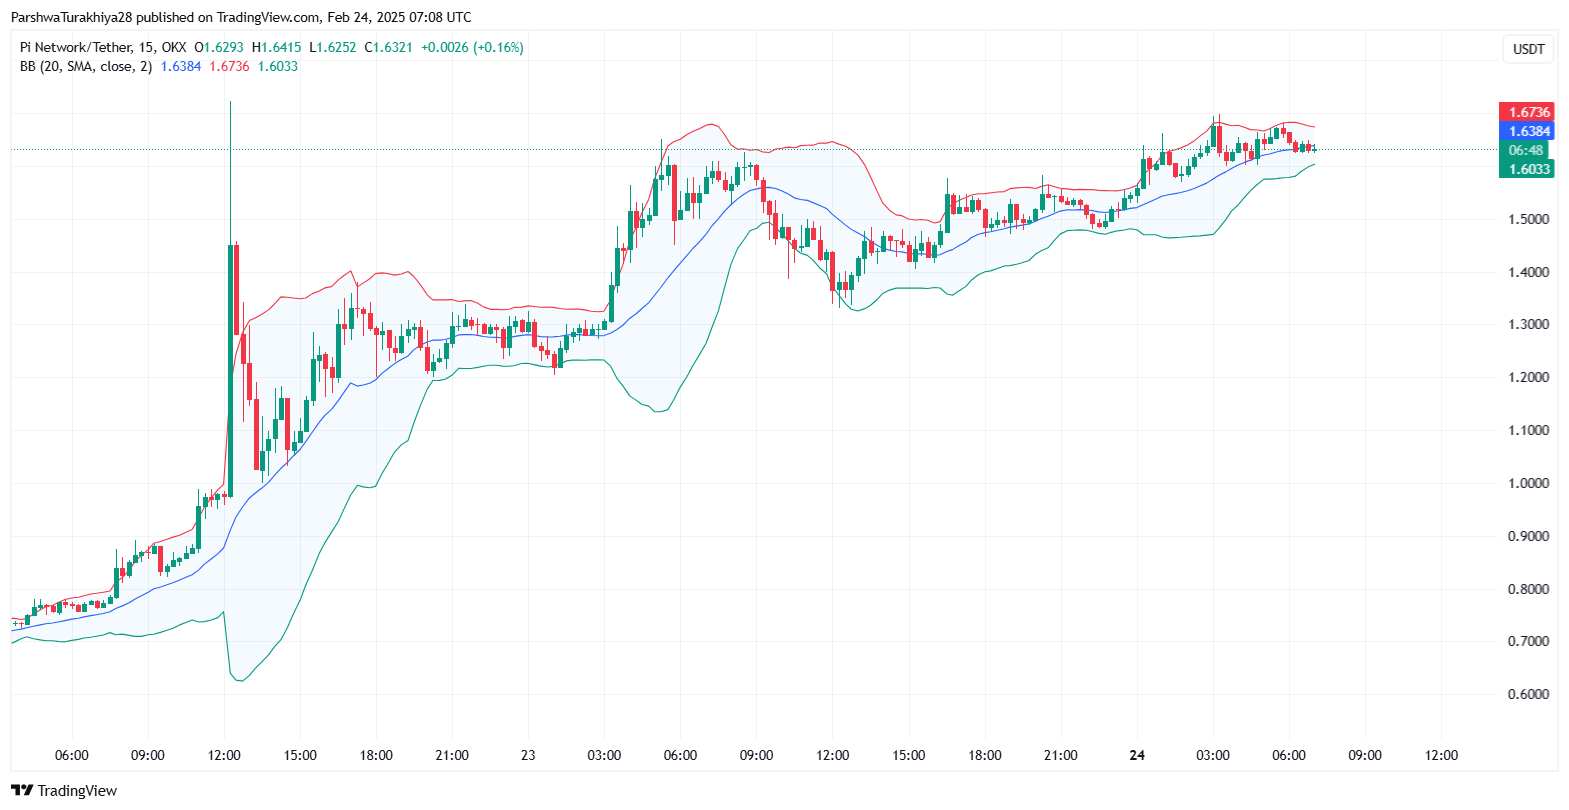
The Bollinger Bands on the Pi Network (PI/USDT) chart indicate a strong bullish trend, with price action consistently testing the upper band. Currently, the upper band is positioned near $1.6759, while the lower band is at $1.5980, forming a volatility range that suggests increased price fluctuations. The middle band, which represents the 20-day Simple Moving Average (SMA), is acting as a dynamic support at $1.6370.
The price has been hovering around this level, indicating that buyers are stepping in to defend key zones. The bands expanded sharply during the previous price rally, showing increased volatility, but have now begun to contract slightly, suggesting a potential consolidation phase before the next breakout. If the price sustains above the upper band, we could see an upward move toward $1.6990, which is a key resistance zone. However, if the price rejects from the upper band, a retracement toward the middle band ($1.6370) or lower band ($1.5980) could be expected. A breakdown below this level might push the price toward $1.5500, a major support that previously held strong during corrections.
MACD Analysis for Pi (PI)
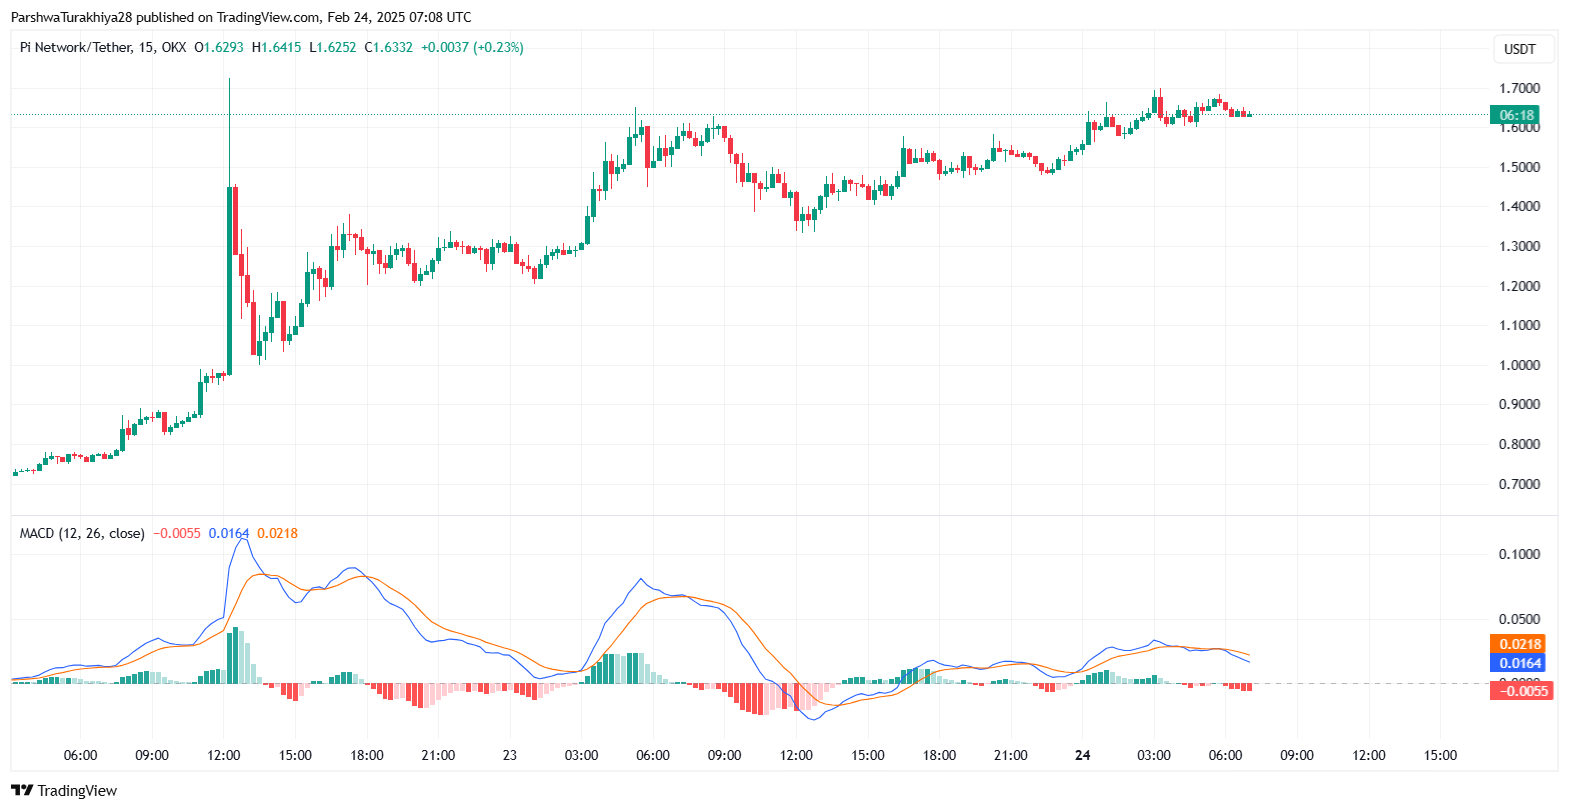
The MACD is currently showing a bullish structure, but there are early signs of momentum slowdown based on the histogram readings. The MACD line is currently at 0.0188, while the signal line is slightly higher at 0.0233, with the histogram displaying a minor negative value (-0.0045). This indicates that while the bullish trend is still in play, the momentum is fading, suggesting that buyers are losing strength. The recent crossover of the MACD line above the signal line confirmed a bullish breakout, but the declining histogram suggests reduced buying volume.
If the MACD line crosses back below the signal line, it could indicate a trend reversal, leading to potential downside movement. For continued upside, the MACD histogram needs to shift back into positive territory, confirming renewed buying pressure. If that happens, the price could continue to rally toward $1.72 or even $1.80 in the near term. On the downside, if the MACD crosses bearish, price weakness could push PI/USDT down toward the $1.55 support zone.
Relative Strength Index (RSI) Analysis for Pi (PI)
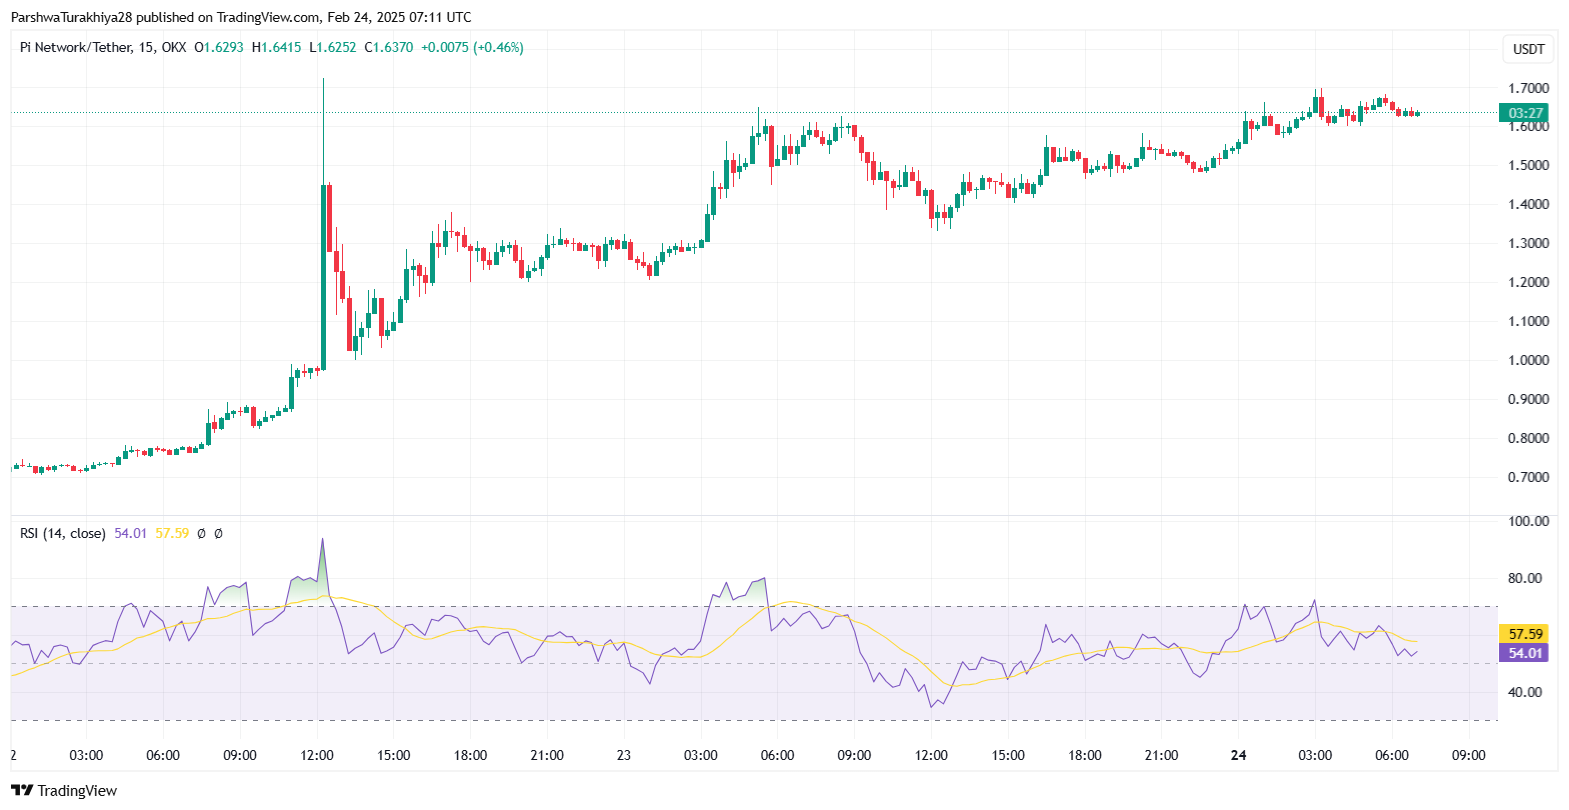
The RSI is currently at 57.78, which places it in neutral to slightly bullish territory. This suggests that there is still room for further upward movement before the market enters an overbought condition, which typically occurs above 70. The RSI previously spiked above 70, signaling an overbought scenario, followed by a corrective pullback, which allowed the market to reset its momentum. The indicator has since rebounded from around 50, confirming that buyers remain active in the market.
If RSI crosses above 60, it would indicate stronger buying pressure, potentially pushing prices above the $1.6990 resistance level and triggering another bullish run toward $1.72 or even $1.80. Conversely, if the RSI starts declining and moves below 50, it would indicate weakening momentum, potentially leading to a price correction toward $1.55-$1.60. If RSI drops below 40, it would further confirm selling pressure, likely triggering a deeper retracement.
Support and resistance levels for Pi (PI)
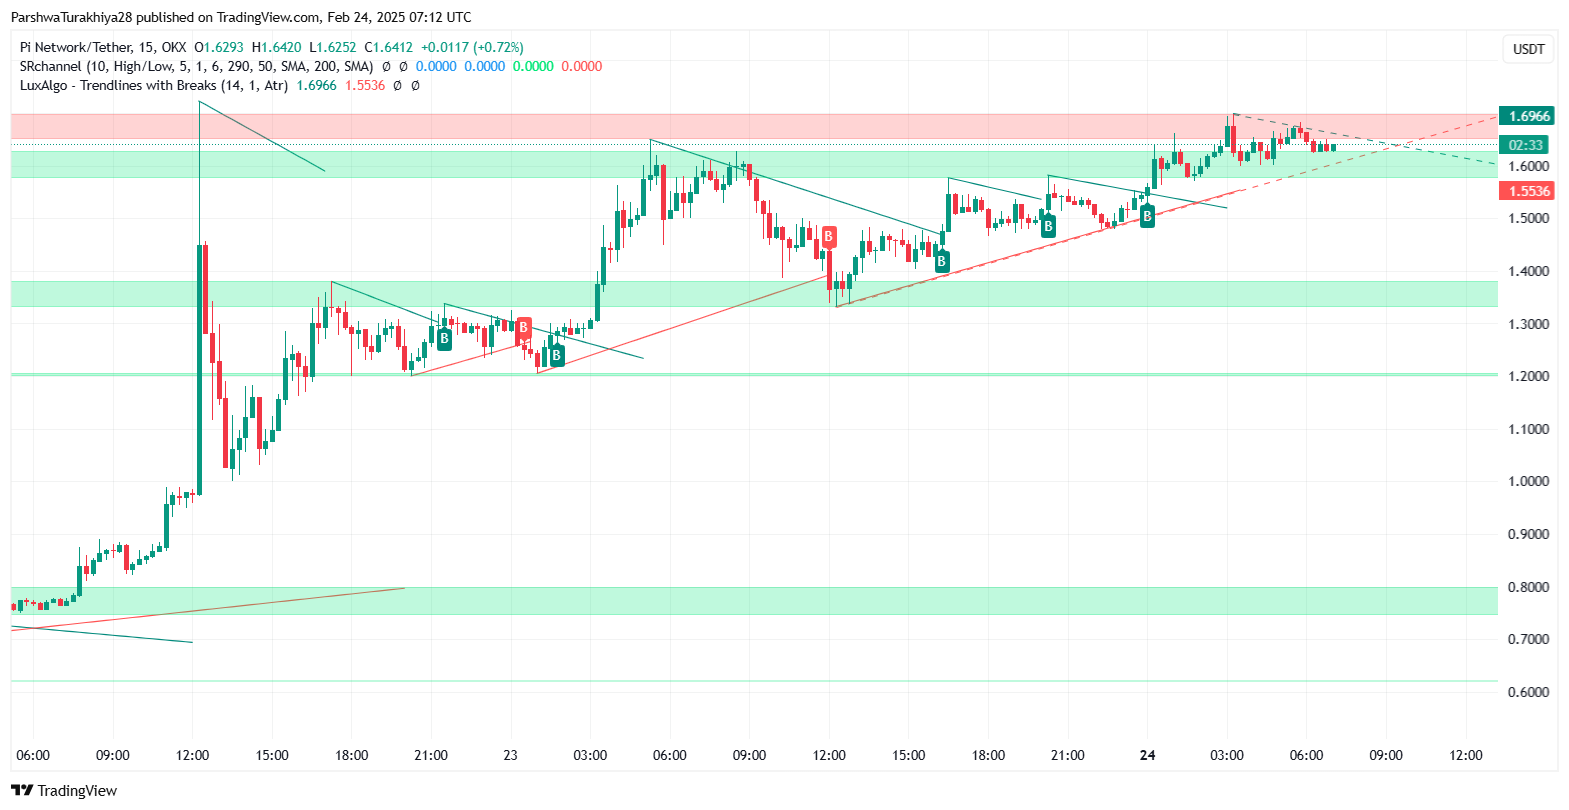
Pi Network (PI/USDT) is currently testing strong resistance at $1.6990, where previous price rejections have occurred. If this level is decisively broken with strong volume, the next target lies around $1.72, with a potential upside extension toward $1.80. However, the failure to break $1.6990 could lead to a correction, especially if selling pressure increases. The nearest support level is at $1.6370, which aligns with the 20-day SMA of the Bollinger Bands. If price falls below this level, the next major support lies at $1.5980, which has previously acted as a strong demand zone.
A break below $1.5980 would expose $1.55, a critical support level that must hold to prevent further bearish movement. If sellers manage to push the price below $1.55, the next major support will be at $1.50, which would mark a significant breakdown. On the bullish side, a confirmed breakout above $1.6990 could lead to a continuation toward $1.72, and if buying volume sustains, we might see extended gains toward $1.80.
Pi (PI) 2025 Price Prediction Analysis
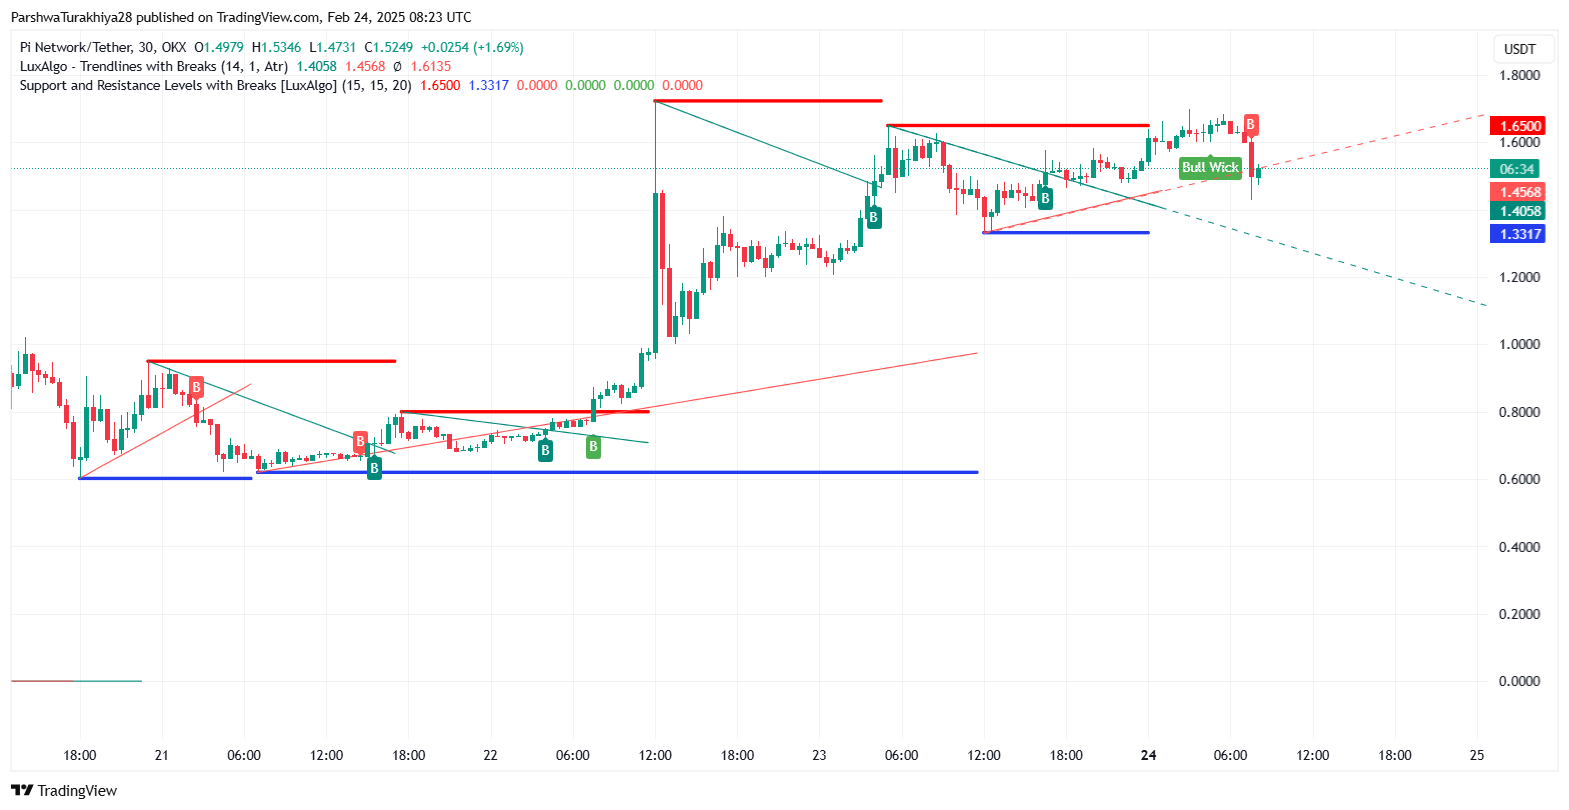
Pi Network (PI) is expected to trade within a projected range of $0.86 to $2.70 in 2025, with an average price hovering around $1.50. Based on the chart analysis, key support and resistance levels will play a crucial role in defining price movements throughout the year.
The primary support zone appears near $1.33, where previous price action has shown strong buyer accumulation. If the price faces downward pressure due to market-wide corrections or sell-offs, this level could act as a stabilizing point, preventing further decline. If this support fails, the next major support is at $1.05, marking a critical level where a rebound may occur. In a worst-case scenario, prolonged bearish sentiment could push PI toward the absolute low of $0.86, aligning with a strong demand zone where long-term investors may re-enter.
On the upside, the immediate resistance level is identified at $1.65, which has acted as a supply zone in the past. A breakout above this could signal renewed bullish momentum, driving the price toward the next major resistance at $2.00. This psychological level will be crucial for price expansion, as overcoming it could shift sentiment toward sustained gains. In the event of a strong market rally and increased adoption, Pi Network could test the yearly high of $2.70, marking the peak potential for 2025.
Overall, price movement within these levels will depend on adoption growth, exchange listings, and broader market trends. Traders should watch for breakouts or rejections at key levels to assess potential trend shifts throughout the year.
Pi (PI) Price Prediction for 2026
In 2026, Pi Network is expected to gain further traction, trading between $1.05 and $5.75, with an average price of $3.40. Growing adoption and potential exchange listings could drive a more stable uptrend, though occasional corrections may occur as the market matures.
Pi (PI) Price Prediction for 2027
By 2027, Pi Network’s price could range between $2.01 and $8.42, with an estimated average of $4.85. Market expansion and ecosystem developments may contribute to higher demand, pushing prices toward new highs, though resistance near $8.42 may test upward momentum.
Pi (PI) Price Prediction for 2028
In 2028, Pi’s projected price is between $2.86 and $11.80, averaging $6.90. If Pi’s network utility strengthens and institutional interest grows, a push beyond $10 could materialize, but periodic consolidations are expected as traders take profits.
Pi (PI) Price Prediction for 2029
By 2029, Pi could trade within $3.94 to $15.50, with an average price of $9.25. Increasing global adoption, coupled with a more established ecosystem, could solidify its position in the market, though external factors such as regulations may influence volatility.
Pi (PI) Price Prediction for 2030
In 2030, Pi Network may trade between $5.65 and $18.90, averaging $12.60. If mainstream adoption accelerates and utility expands, PI could break past $15, establishing new long-term support levels and setting the stage for sustained growth in the crypto market.
FAQs
Pi Network is projected to trade between $0.86 and $2.70, with an estimated average price of $1.50 based on current market trends.
The primary resistance levels for Pi in 2025 are $1.65, $2.00, and $2.70, with $2.00 acting as a psychological barrier for further upward movement.
Major support zones include $1.33, $1.05, and $0.86, with $1.33 being a key level to hold for maintaining bullish momentum.
While $3.00 is beyond the current projection, a strong bull market and higher adoption could push PI toward $2.70 or beyond, but resistance at $2.00 needs to be cleared first.
Potential exchange listings, ecosystem expansion, and increased adoption of Pi’s blockchain technology could contribute to bullish price movement throughout 2025.
Yes, given its recent market debut, PI is expected to experience significant price swings, with both rapid surges and sharp corrections shaping its movement.
The February 2025 mainnet launch increased volatility, with initial price spikes followed by corrections. Sustained market adoption will determine long-term growth.
Positive sentiment and increasing investor confidence can push PI toward resistance levels, while uncertainty or sell-offs can test lower support zones like $1.05 or $0.86.
Pi’s growth potential is notable due to its unique mobile mining model, but its market liquidity and adoption rate will dictate whether it outperforms competitors.
If Pi Network secures strong utility and global adoption, it could reach $5-$10 levels by 2028-2030, provided it establishes a sustainable ecosystem and liquidity remains high.
Disclaimer: The information presented in this article is for informational and educational purposes only. The article does not constitute financial advice or advice of any kind. Coin Edition is not responsible for any losses incurred as a result of the utilization of content, products, or services mentioned. Readers are advised to exercise caution before taking any action related to the company.

 Price Prediction: Can Bulls Break the $329 Barrier?")


