 Price Prediction & Analysis for July 12")
The Pi Coin price is making a fresh push above the $0.50 level after consolidating below key support zones for nearly three weeks. As of July 11, Pi Coin price today is trading at $0.5025, up nearly 1.2% over the past 24 hours. This recovery comes after reclaiming the lower boundary of the June-July descending channel, backed by rising momentum across intraday charts.
What’s Happening With Pi Coin’s Price?
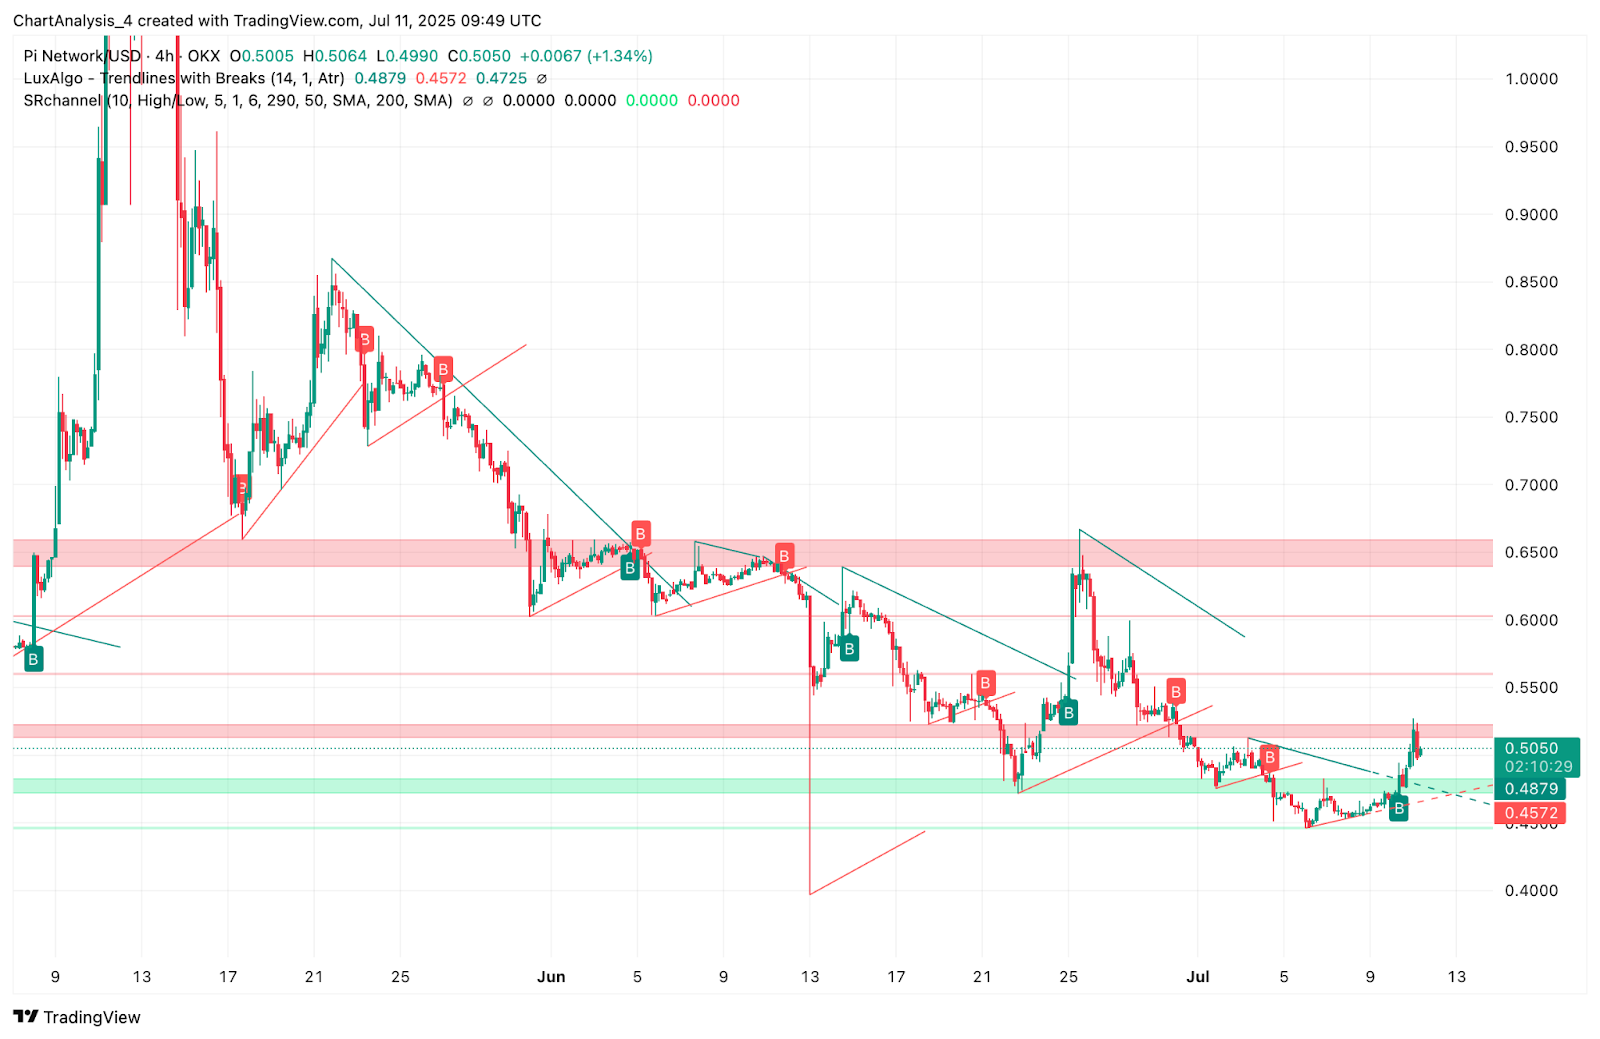
On the 4-hour chart, Pi Coin price action shows a confirmed breakout from a descending wedge structure that began in late June. The break above $0.4870 has flipped the Supertrend bullish and triggered a sharp rise toward $0.5060. This marks the first time since June 28 that PI has closed decisively above its EMA50 and EMA100, signaling a shift in short-term sentiment.
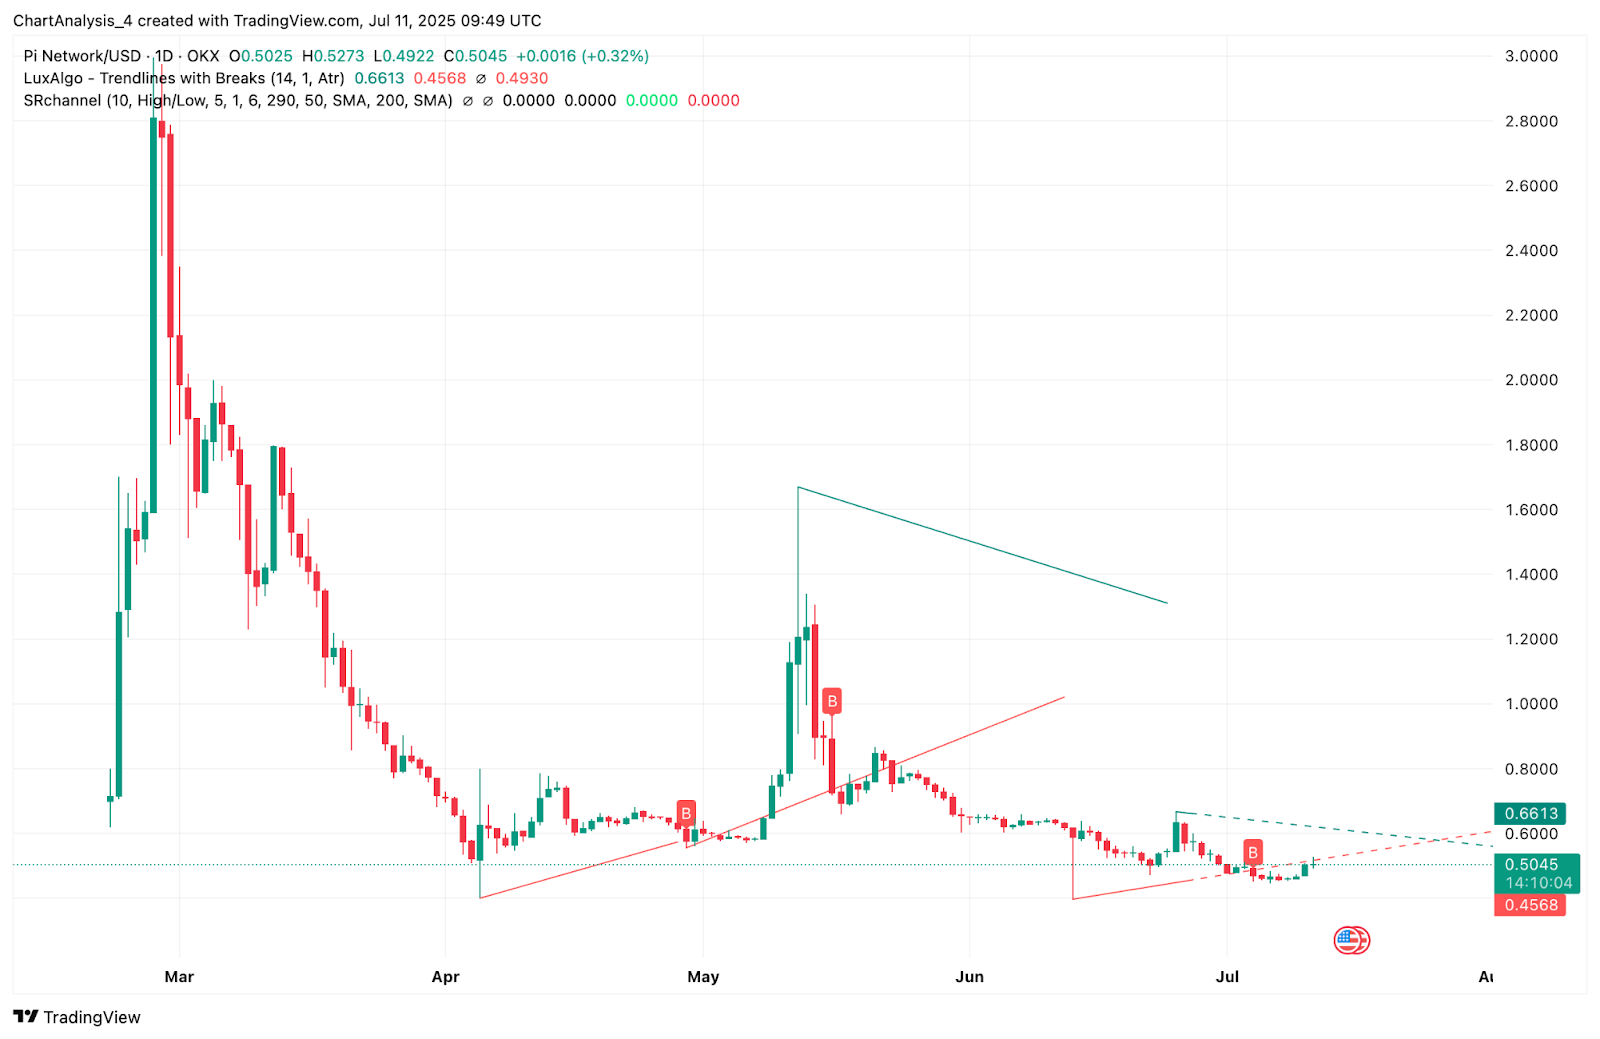
The daily chart also shows price attempting to break out from a larger triangle consolidation. Pi has now printed two green candles in a row after defending the $0.4460 low. Meanwhile, the 0.236 Fibonacci level near $0.4830 is acting as reclaimed support, while the 0.382 Fib at $0.5130 is now being tested as near-term resistance.
Volume has increased slightly, but not impulsively, suggesting that while momentum is returning, a strong catalyst may still be needed to trigger further upside.
Why Is The Pi Coin Price Going Up Today?
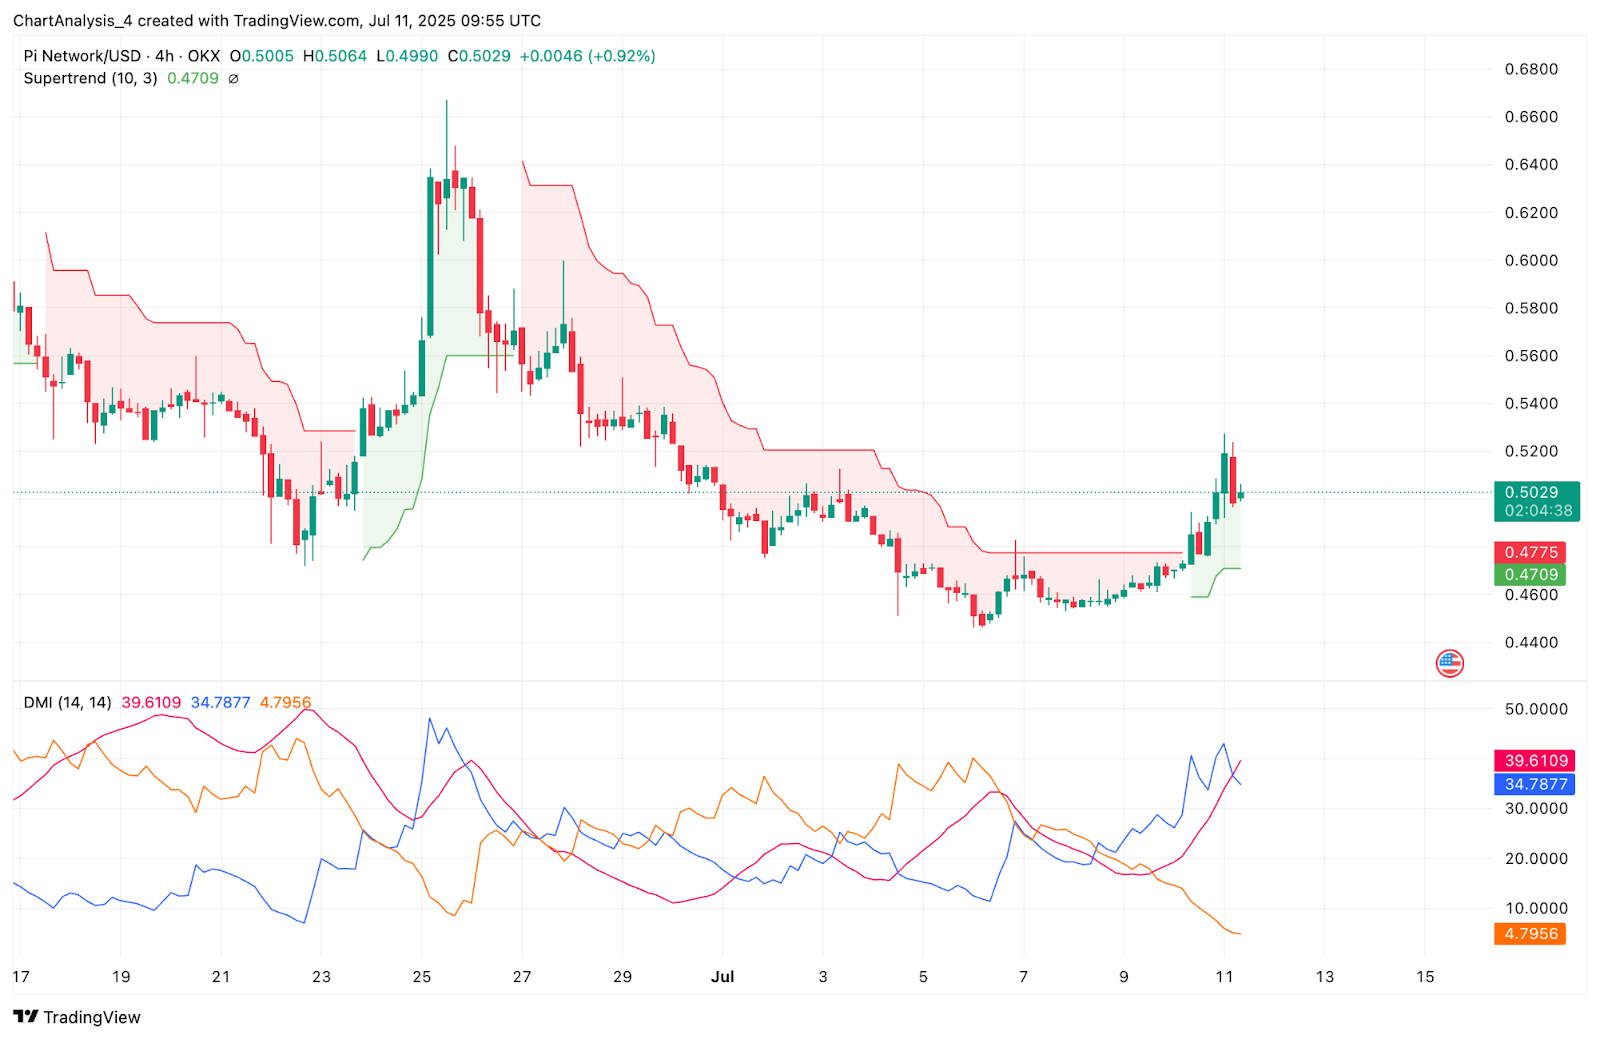
The breakout in Pi Coin price today is being fueled by multiple converging signals. The DMI on the 4-hour chart shows a fresh bullish crossover, with the +DI crossing above the -DI while ADX rises toward 40. The Supertrend has also flipped green with a support base at $0.4709, further validating the bullish sentiment that emerged after July 9.
This signals a strengthening trend. Supporting this, the Parabolic SAR dots have flipped below price for the first time in over a week, indicating trend confirmation.
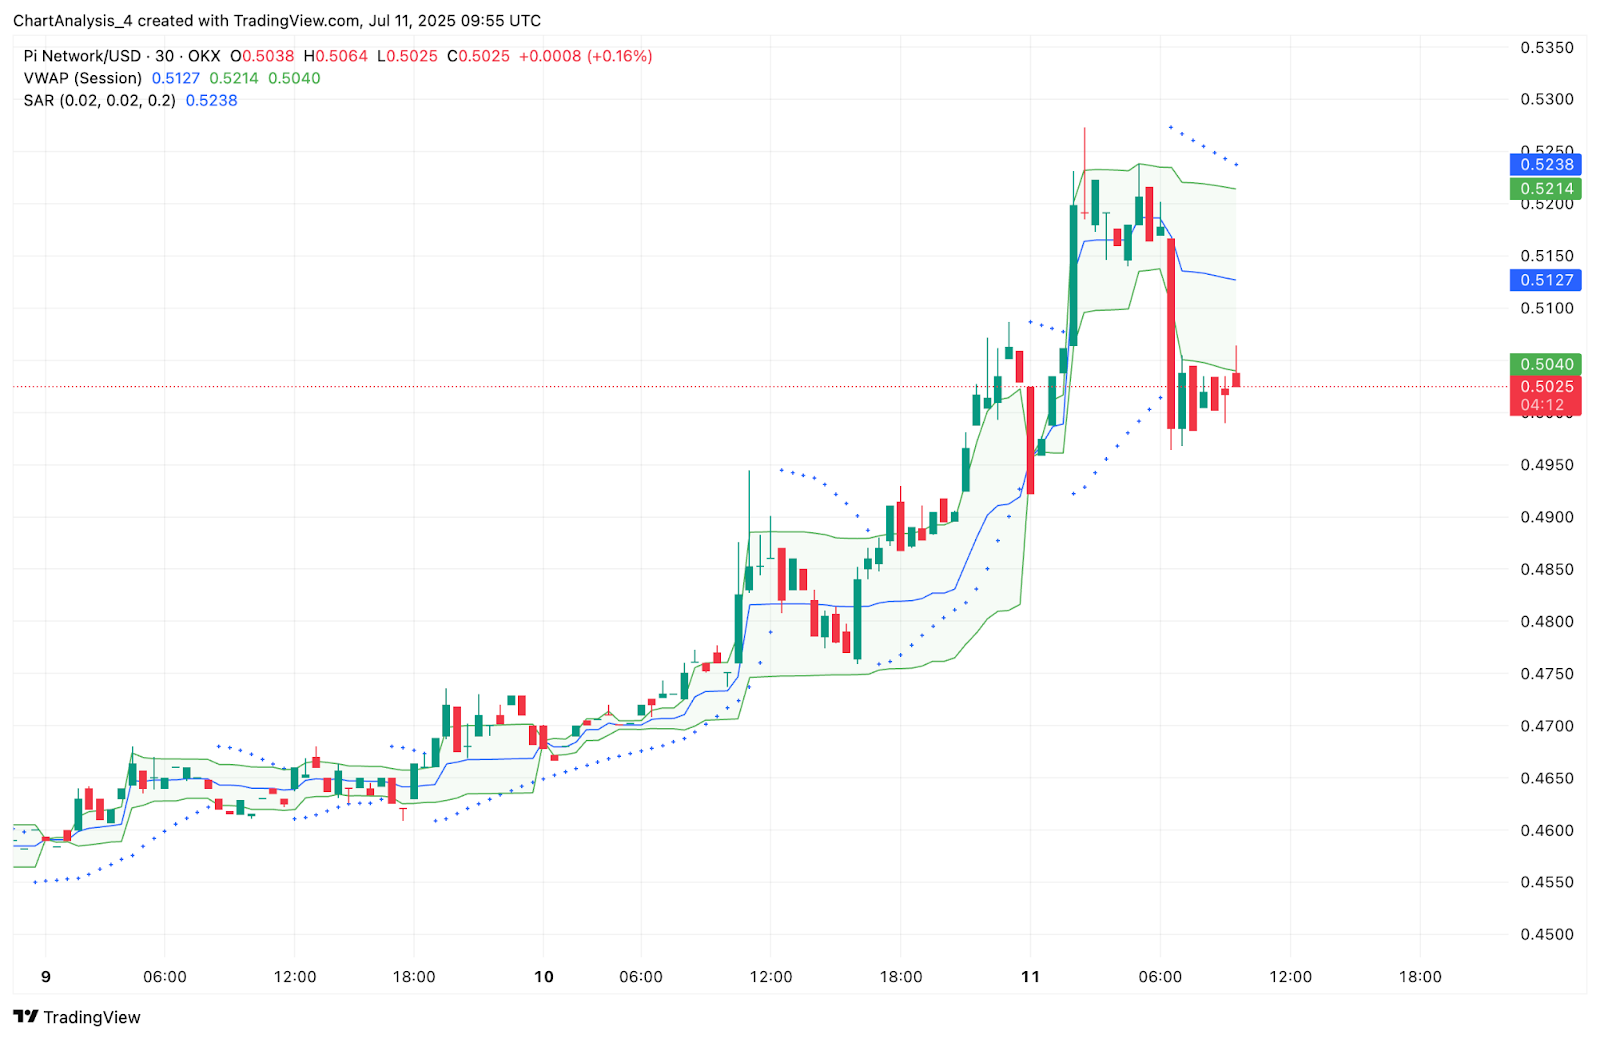
On the 30-minute chart, price has reclaimed the VWAP and remains above the SAR dots, with intraday bands expanding. This shows buyers are gradually regaining intraday control.
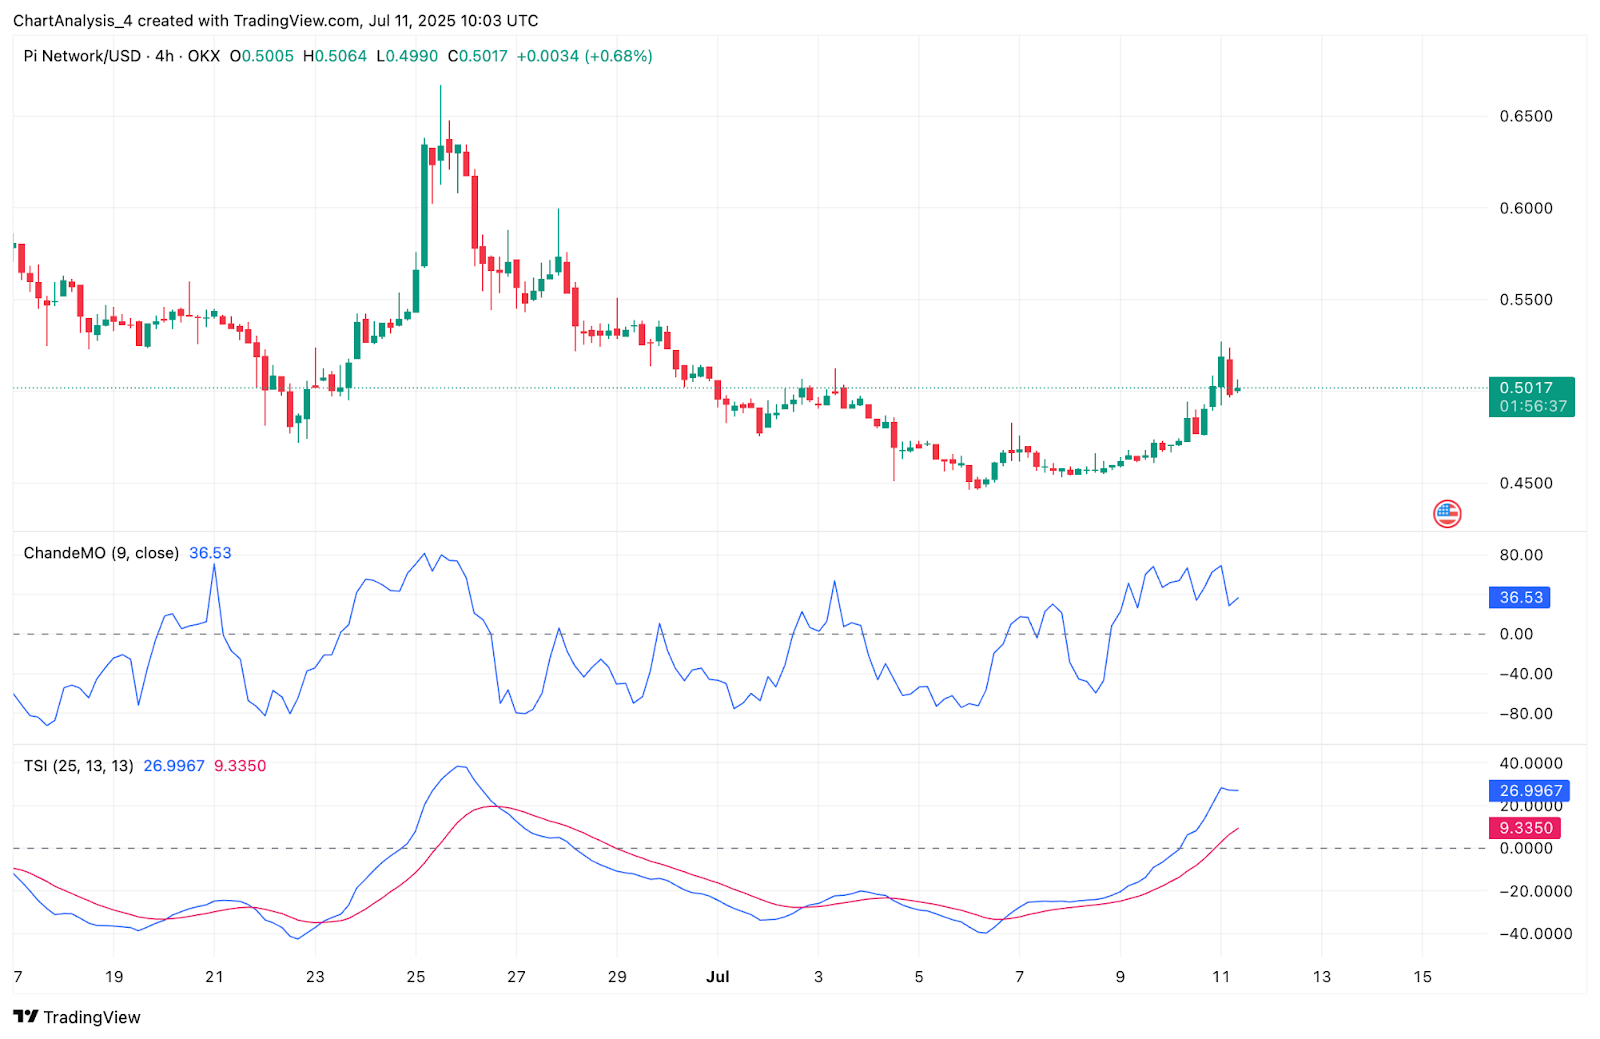
Moreover, the Chande Momentum Oscillator (CMO) and the True Strength Index (TSI) are both rising steadily, with TSI now at 26.99 and CMO above 36. These figures support an early trend shift from bearish to bullish.
Momentum Signals Align With Fib Cluster and EMA Resistance
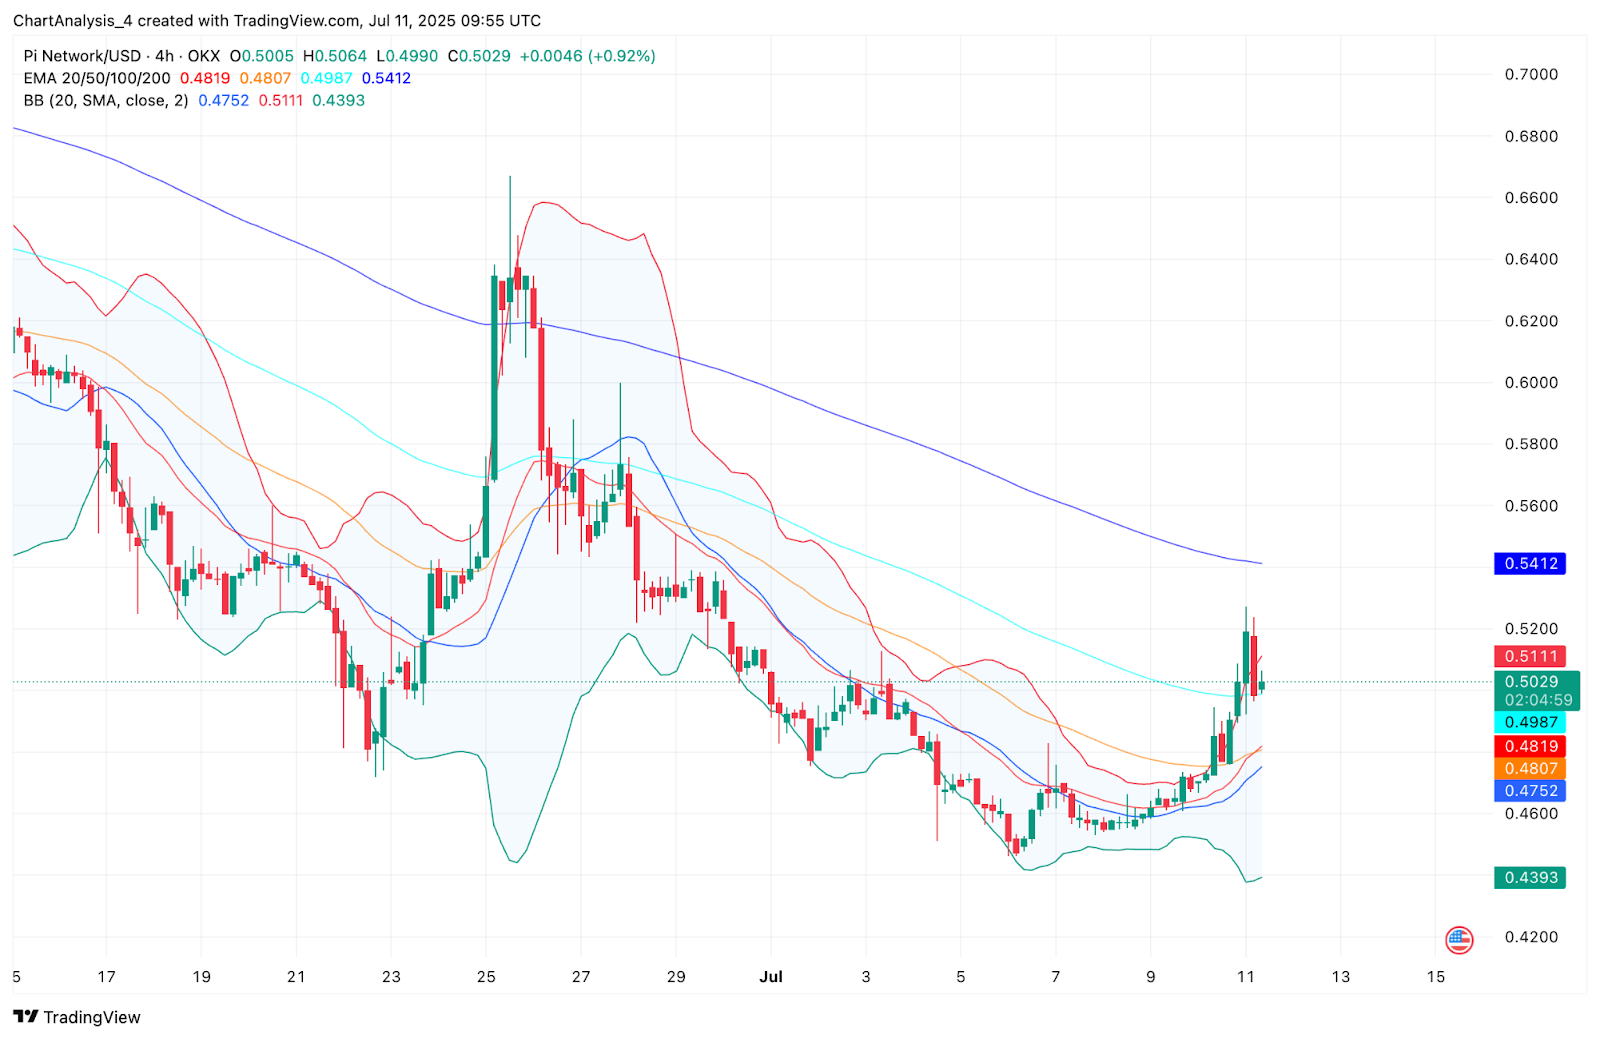
Technical indicators are converging around key resistance levels. Pi’s price is currently testing the upper Bollinger Band near $0.5110, while the EMA200 (4-hour) at $0.5412 presents a critical hurdle if bulls sustain control. The 0.5 Fibonacci level at $0.5566 is the next major upside barrier if price breaks cleanly above $0.5130.
However, traders should note that volatility is expanding. Bollinger Band width has widened and candles are showing longer wicks, suggesting early profit-taking. A rejection below $0.5130 could push price back to $0.4870–$0.4750 in the short term.
PI Price Prediction: Short-Term Outlook (24h)
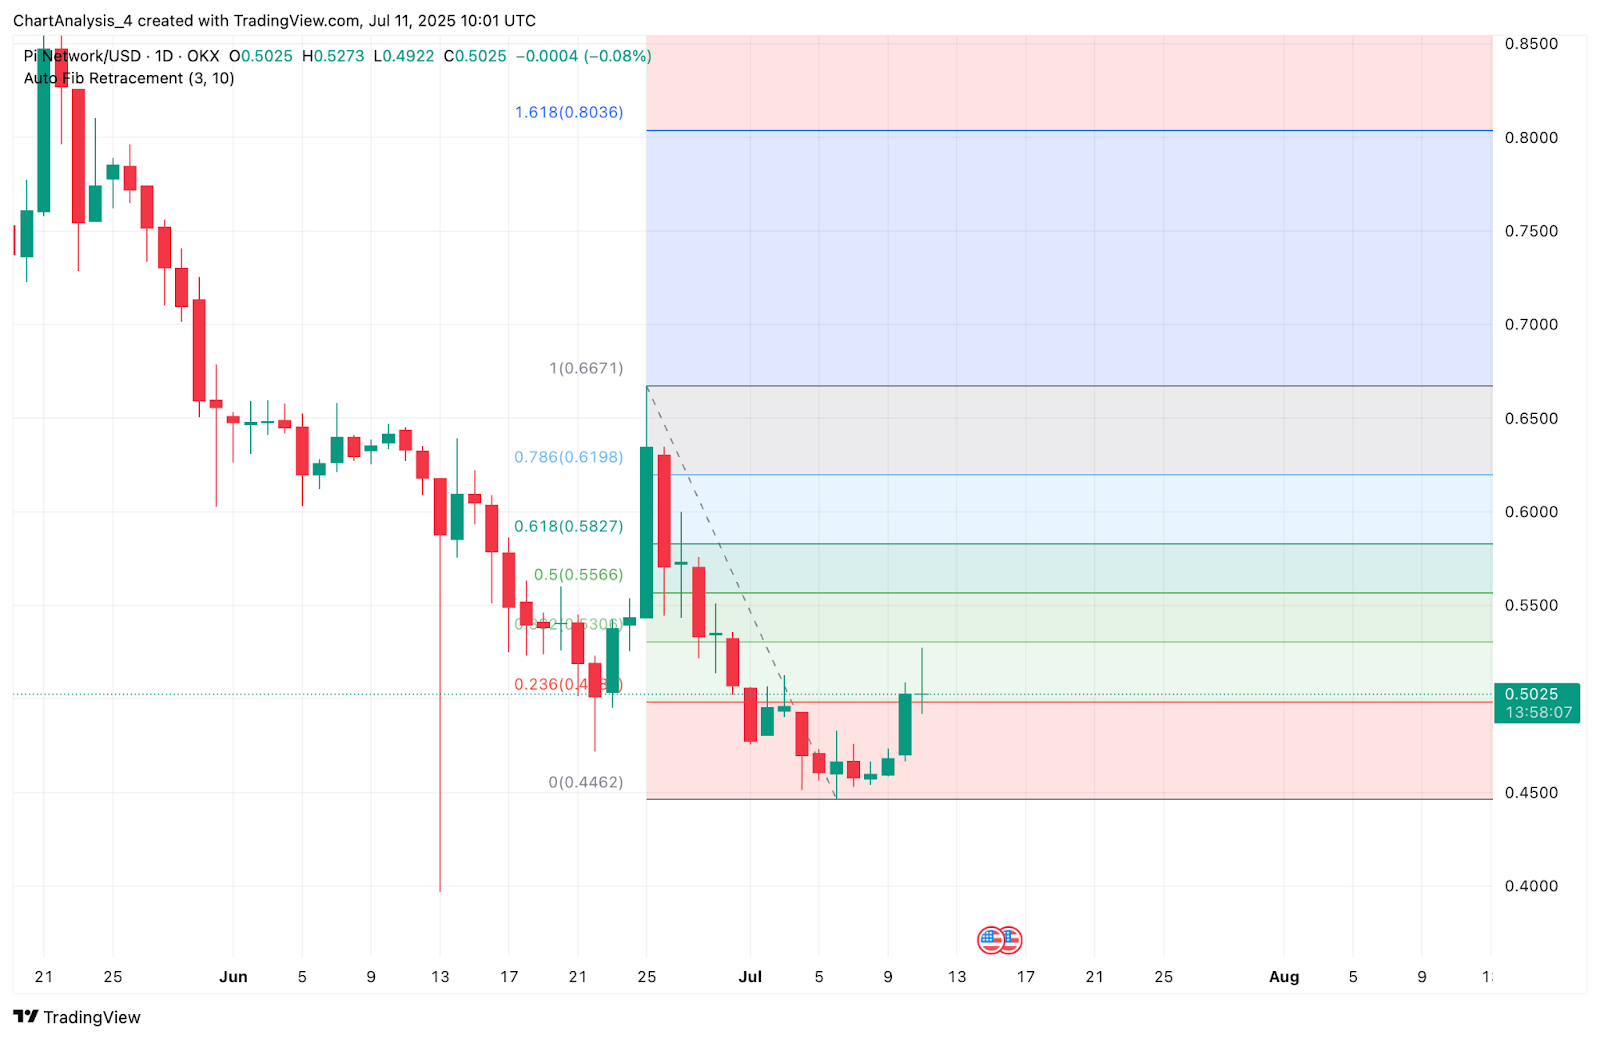
Pi Coin price appears poised for a retest of $0.5130, and potentially $0.5300 if momentum holds. A clean break above $0.5300 would open the door toward $0.5566 (Fib 0.5), followed by $0.5827 (Fib 0.618).
If bulls lose the $0.4870 support again, Pi may revisit the prior base at $0.4570. Below that, the next support lies at $0.4460, which was the swing low from late June.
Overall, the structure is tilting bullish, but sustained momentum will depend on volume confirmation and holding above $0.4870 on closing basis.
Pi Coin Price Forecast Table: July 12, 2025
| Indicator/Zone | Level / Signal |
| Pi Coin price today | $0.5025 |
| Resistance 1 | $0.5130 (Fib 0.382 / Upper BB) |
| Resistance 2 | $0.5566 (Fib 0.5) |
| Support 1 | $0.4870 (Prior structure) |
| Support 2 | $0.4570 / $0.4460 (Swing Low) |
| Supertrend (4H) | Flipped Bullish @ $0.4709 |
| DMI (14) | +DI > -DI, ADX rising toward 40 |
| EMA Cluster (4H) | 20/50/100 below, 200 @ $0.5412 |
| Bollinger Bands (4H) | Expanding with breakout wick |
| VWAP (30-min) | Reclaimed, intraday bullish |
| SAR (30-min) | Flipped below price |
| ChandeMO / TSI | 36.5 / 26.9 — bullish momentum |
Disclaimer: The information presented in this article is for informational and educational purposes only. The article does not constitute financial advice or advice of any kind. Coin Edition is not responsible for any losses incurred as a result of the utilization of content, products, or services mentioned. Readers are advised to exercise caution before taking any action related to the company.


