
Pi Network price today is trading near $0.5440 after a series of failed bullish breakout attempts in recent weeks. Despite brief rallies above the $0.60 mark, bearish pressure continues to dominate the mid-June landscape, leading to tight consolidation just above a weak low zone. As traders ask why Pi Network price went down today, the answer appears rooted in persistent lower highs, diminished momentum, and fading speculative demand.
What’s Happening With Pi Network’s Price?
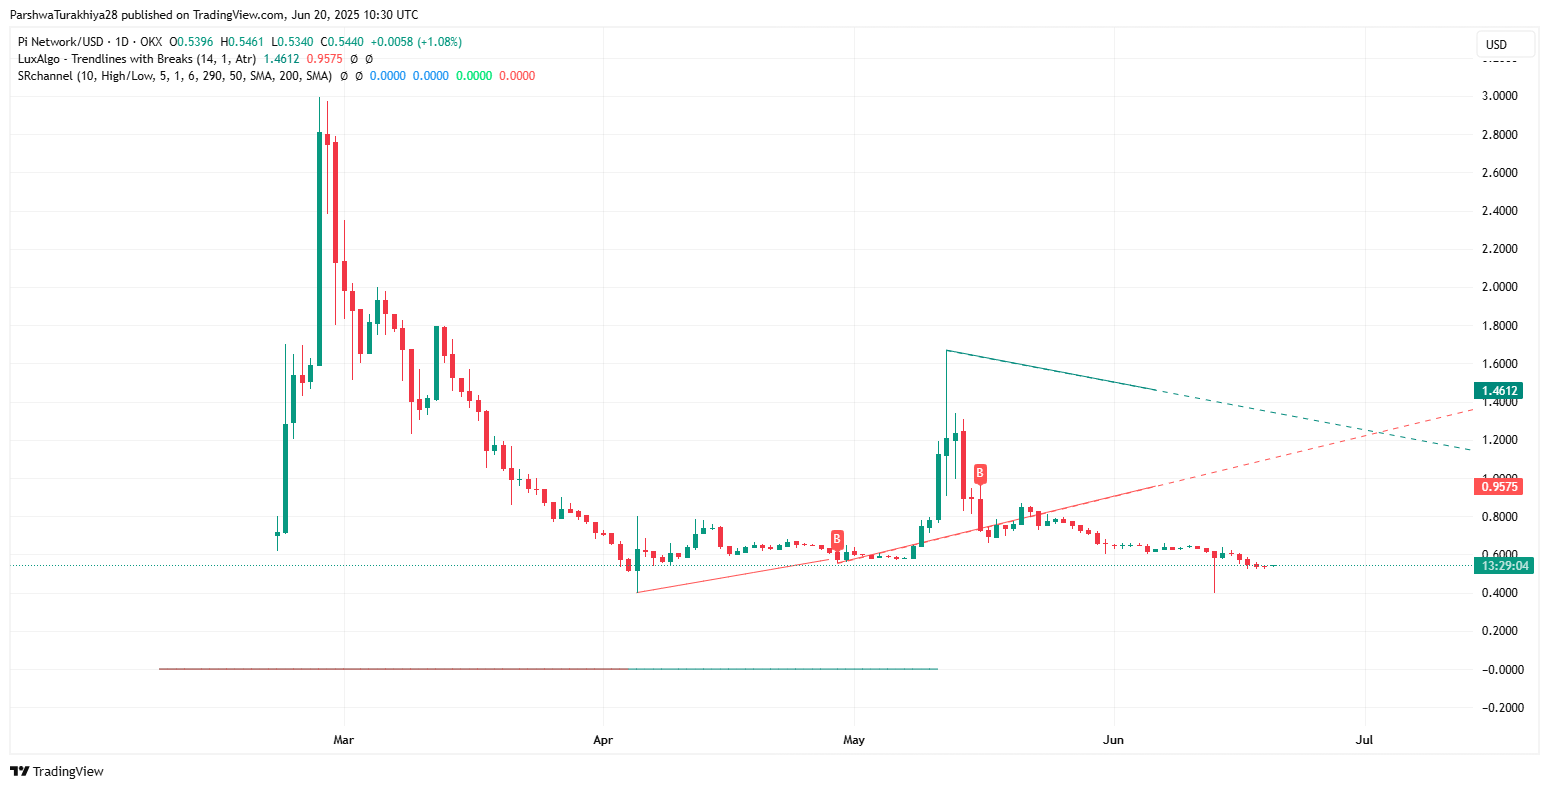
On the daily chart, the Pi Network price action remains trapped in a broader descending triangle, defined by consistent lower highs and a flat support near $0.44. The failure to reclaim the trendline from early May’s breakdown suggests ongoing bearish dominance. A decisive candle close below $0.52 would confirm a continuation of this descending pattern, with the next major support near $0.40.
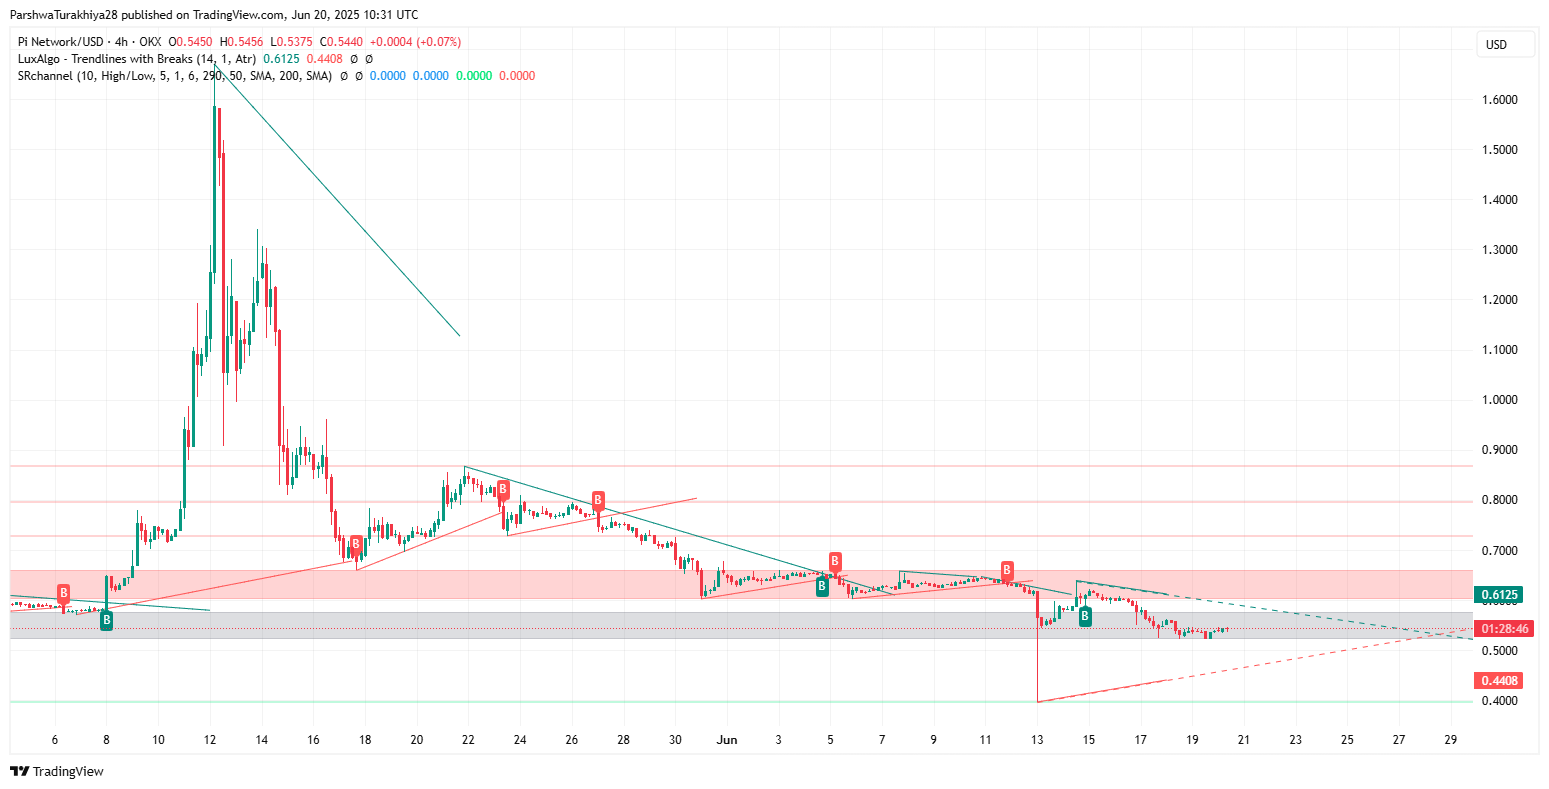
On the 4-hour chart, the situation shows more complexity. Pi has printed a series of micro-ascending channels that consistently failed to break past the $0.61 resistance zone. This level remains a supply cluster formed after the breakdown from early June. The chart shows repeated failures near this region, highlighting a heavy overhead supply and reinforcing the bearish tone.
Pi Price Prediction: EMA and Bollinger Structures Add Bearish Weight
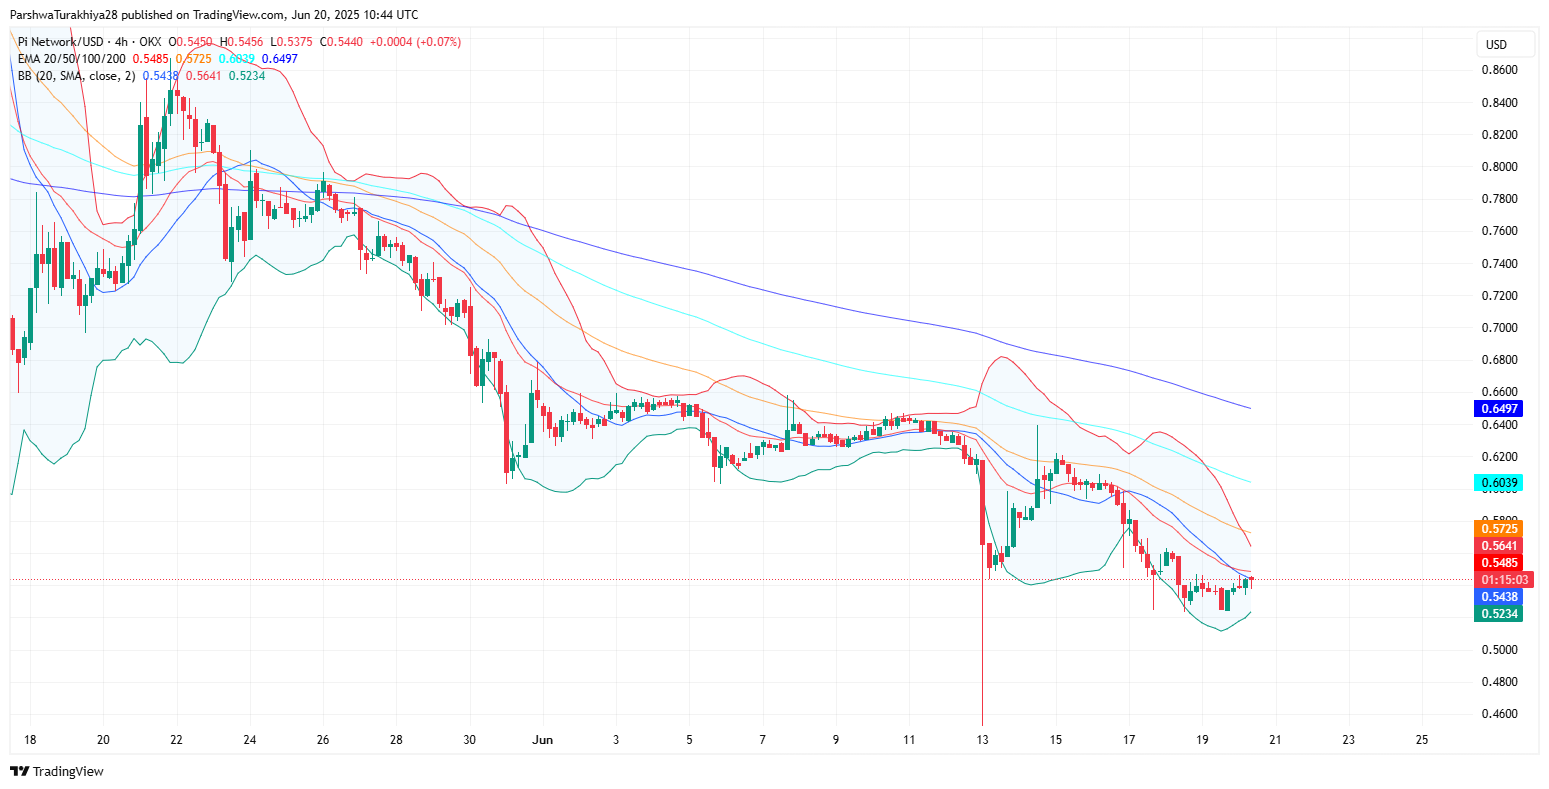
The 4-hour chart shows that the Pi Network price remains capped below the tightly stacked 20/50/100/200 EMAs, which range between $0.5485 and $0.6497. Price is currently hovering just beneath the 20 EMA, with all higher EMAs aligned in a bearish formation. This layered resistance structure reinforces a strong overhead ceiling and reflects sustained short- to long-term downward pressure. For any bullish momentum to gain credibility, buyers would need to break above this entire cluster—particularly the 200 EMA near $0.65, which has acted as a trend-defining barrier since early June.
Meanwhile, Bollinger Bands are beginning to tighten again, indicating suppressed Pi Network price volatility. However, recent lower wicks piercing the bottom band near $0.5230 suggest that sellers are still probing downside liquidity, keeping risk tilted to the downside unless a clean reclaim above $0.56–$0.57 is seen.
Pi Network Price: Indicators Show Weak Momentum Despite Small Bounce
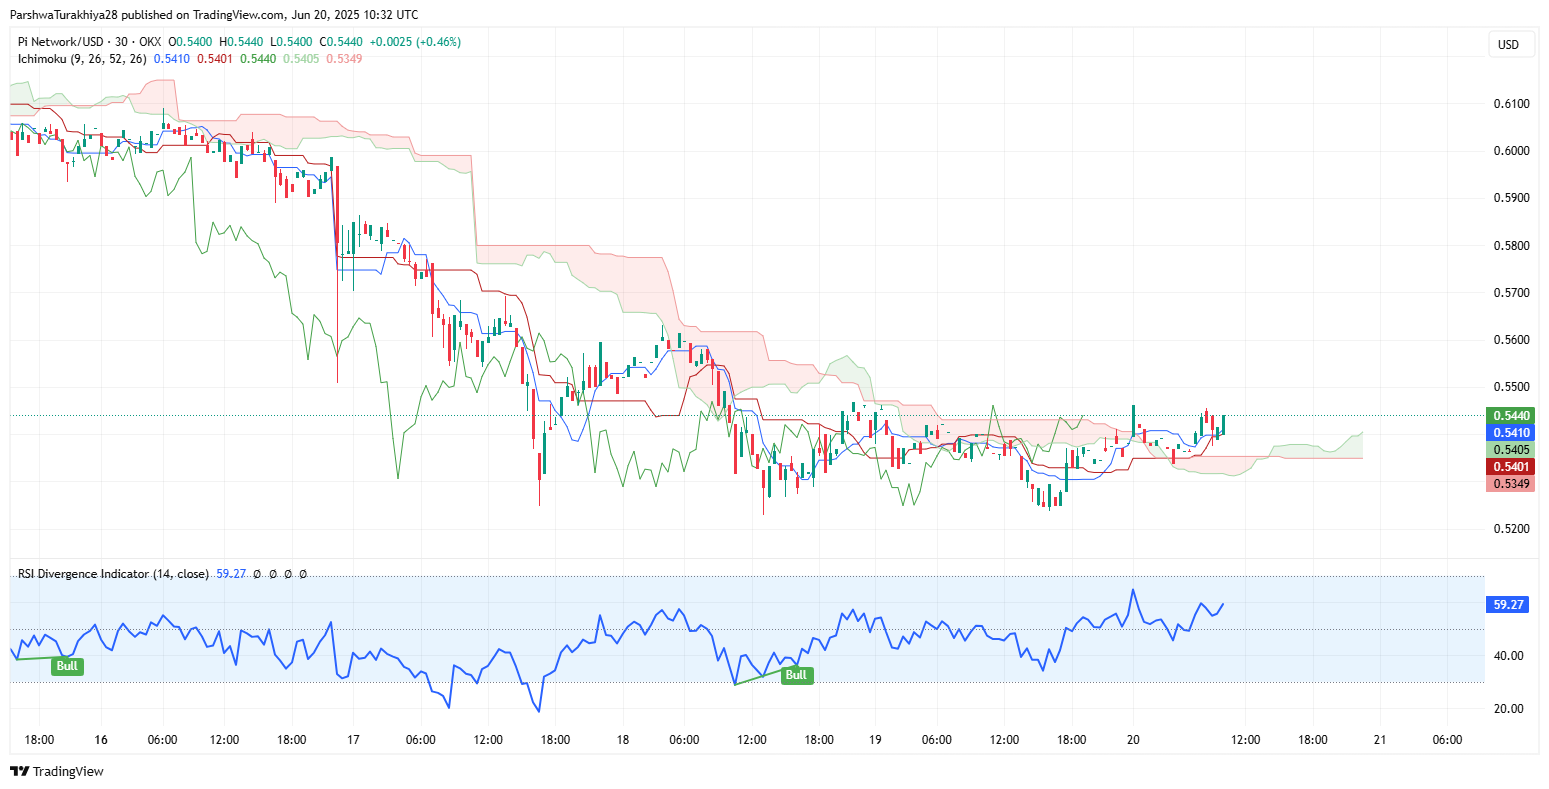
Ichimoku Cloud analysis shows the price attempting to test the bottom of the Kumo around $0.5440. The Tenkan-Sen and Kijun-Sen lines have begun to flatten, indicating indecision. The Lagging Span is still below price and the cloud, reinforcing the weak trend structure.
The RSI on the 30-minute chart is near 59.27 and has printed two bullish divergence signals in the last 24 hours. While this offers some short-term encouragement, it is not enough to override the broader bearish structure seen on higher timeframes.

The Chande Momentum Oscillator remains below the neutral 0-line at 13.69, reflecting lackluster buying pressure.
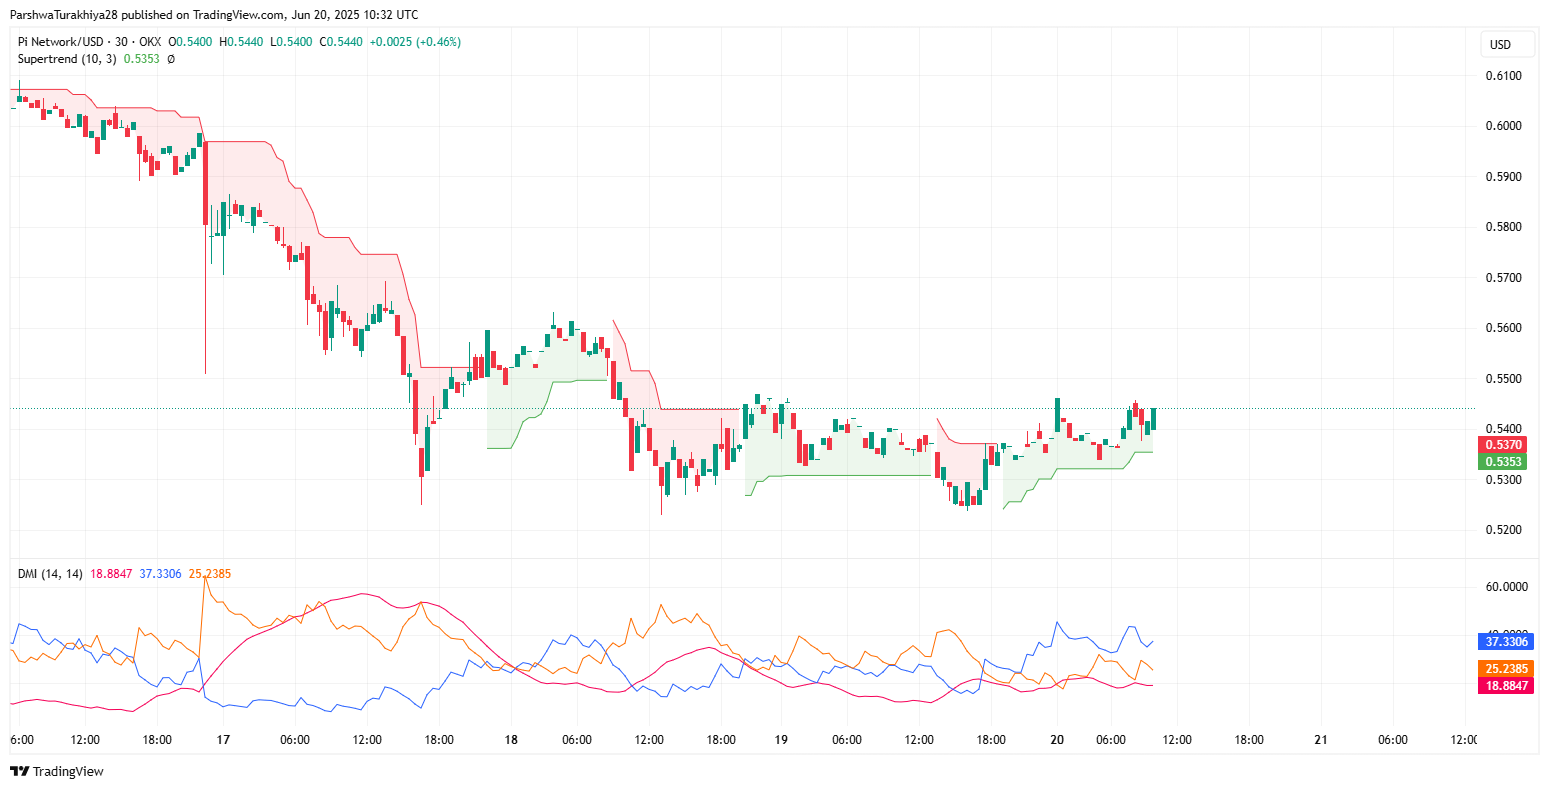
Supertrend (10,3) flipped green on the 30-minute chart, which signals that Pi Network price spikes may occur if bulls push beyond $0.55. However, such spikes will likely face resistance at $0.5650 and again at $0.5880.
Pi Network Price: Smart Money Outlook and Volume Structures
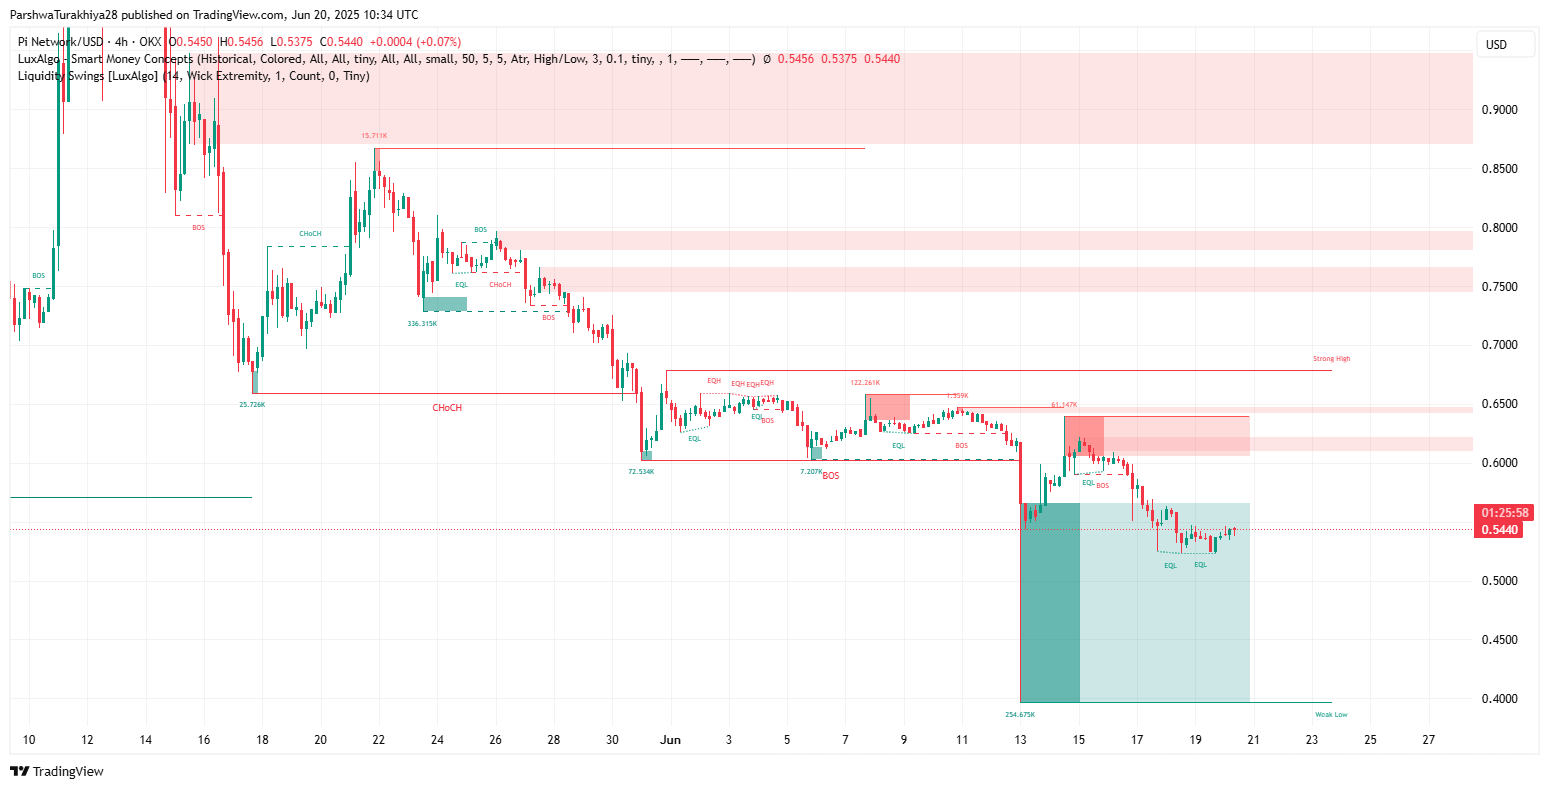
Smart Money Concepts (SMC) reveal multiple Breaks of Structure (BOS) to the downside in recent sessions. The latest Equal Lows (EQL) around $0.5200 remain unbroken but vulnerable. The order block above $0.60 continues to act as a key distribution zone, and no clear Change of Character (ChoCH) has occurred to suggest a reversal in trend.
Volume analysis confirms this caution. The most recent breakout attempts lacked significant volume, with visible imbalances favoring sellers. If these lows at $0.52–$0.50 are lost, the next high-liquidity zone lies near $0.44, matching the base of the broader descending triangle from the daily chart.
Pi Price Short-Term Forecast: Range-Bound With Bearish Tilt
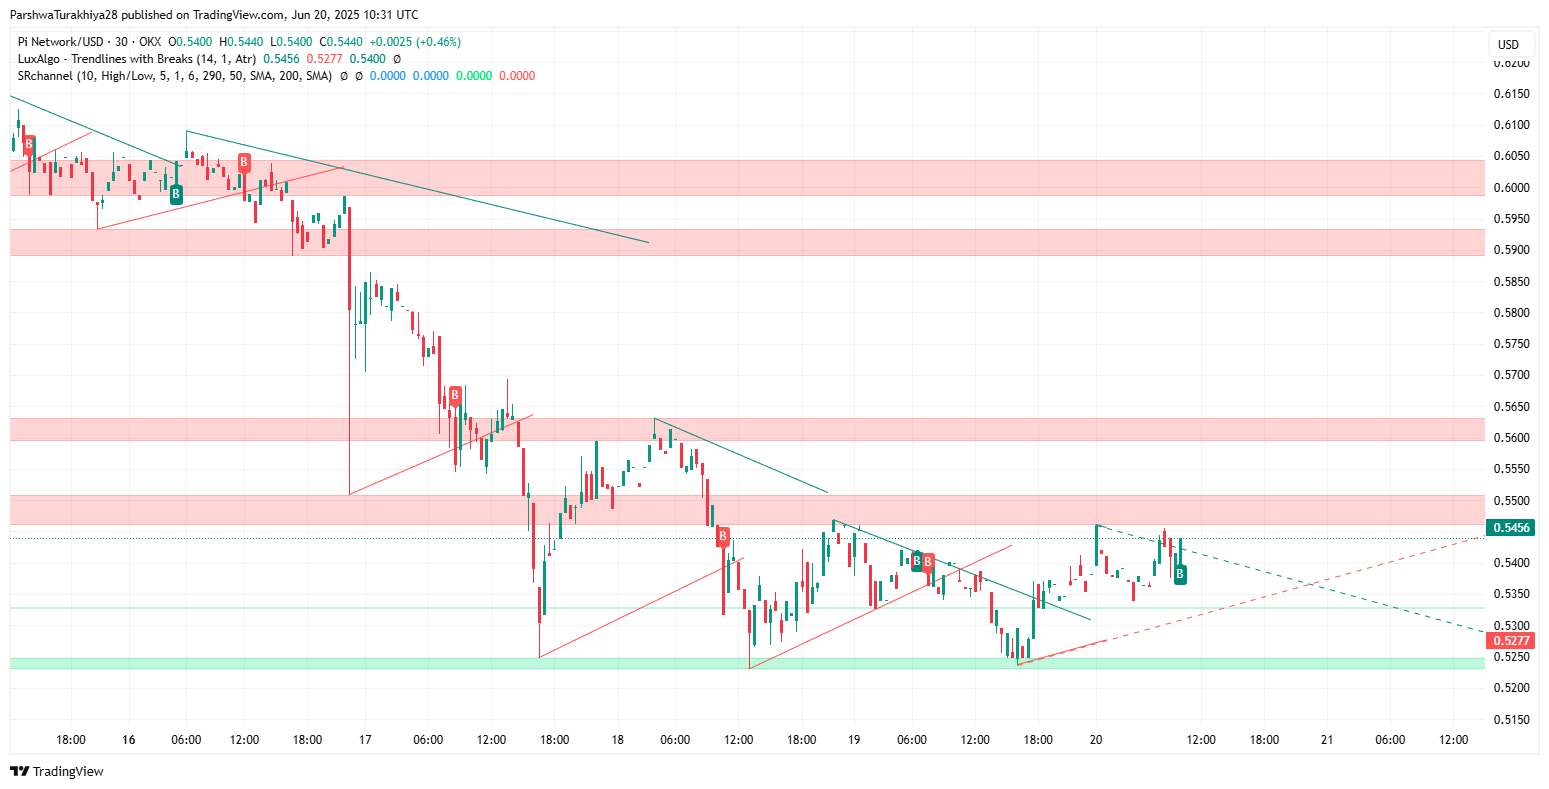
For June 21, the outlook for Pi Network price remains tilted to the downside unless bulls can force a breakout above the $0.5550 resistance and sustain volume. With momentum indicators mixed and price sitting just under key EMA resistance, traders should prepare for either a sharp flush below $0.52 or another failed rally into supply at $0.5650.
Pi Network Price Forecast Table
| Metric | Value | Signal |
| Pi Network price today | $0.5440 | Neutral |
| 4H EMA Cluster | $0.5450–$0.6125 | Bearish Rejection Zone |
| RSI (30-min) | 59.27 | Slightly Bullish Divergence |
| Supertrend (30-min) | $0.5353 (Support) | Bullish Shift Attempt |
| Major Support Zone | $0.44–$0.50 | Key Demand Area |
| Resistance Levels | $0.5550, $0.5880 | Likely Rejection Zones |
| Ichimoku Cloud | Under Kumo | Bearish Trend Structure |
| Smart Money Structure | EQL Holding @ $0.52 | Weak Bullish Defense |
Disclaimer: The information presented in this article is for informational and educational purposes only. The article does not constitute financial advice or advice of any kind. Coin Edition is not responsible for any losses incurred as a result of the utilization of content, products, or services mentioned. Readers are advised to exercise caution before taking any action related to the company.


