 Price Prediction for June 22, 2025: Can PI Hold Above $0.53 as Volatility Compresses?")
The Pi Network price today is hovering around $0.535, consolidating just above a key short-term support band after recent downside pressure. Following a breakdown earlier this month, PI has entered a low-volatility phase, with momentum indicators showing exhaustion. Traders watching for Pi Network price spikes are eyeing the narrowing Bollinger Bands and flat EMA structures for clues on the next move.
What’s Happening With Pi Network’s Price?
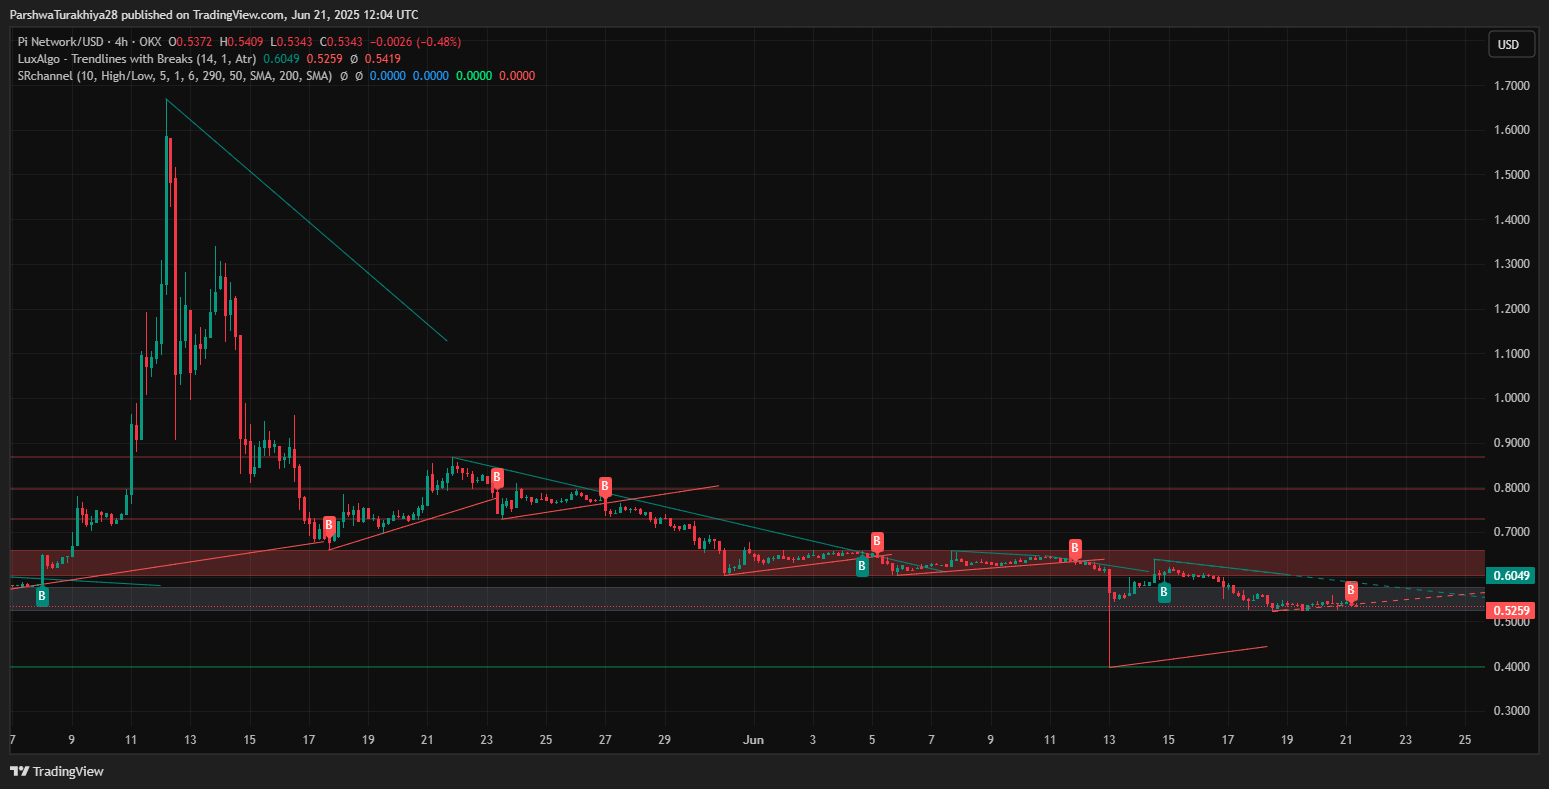
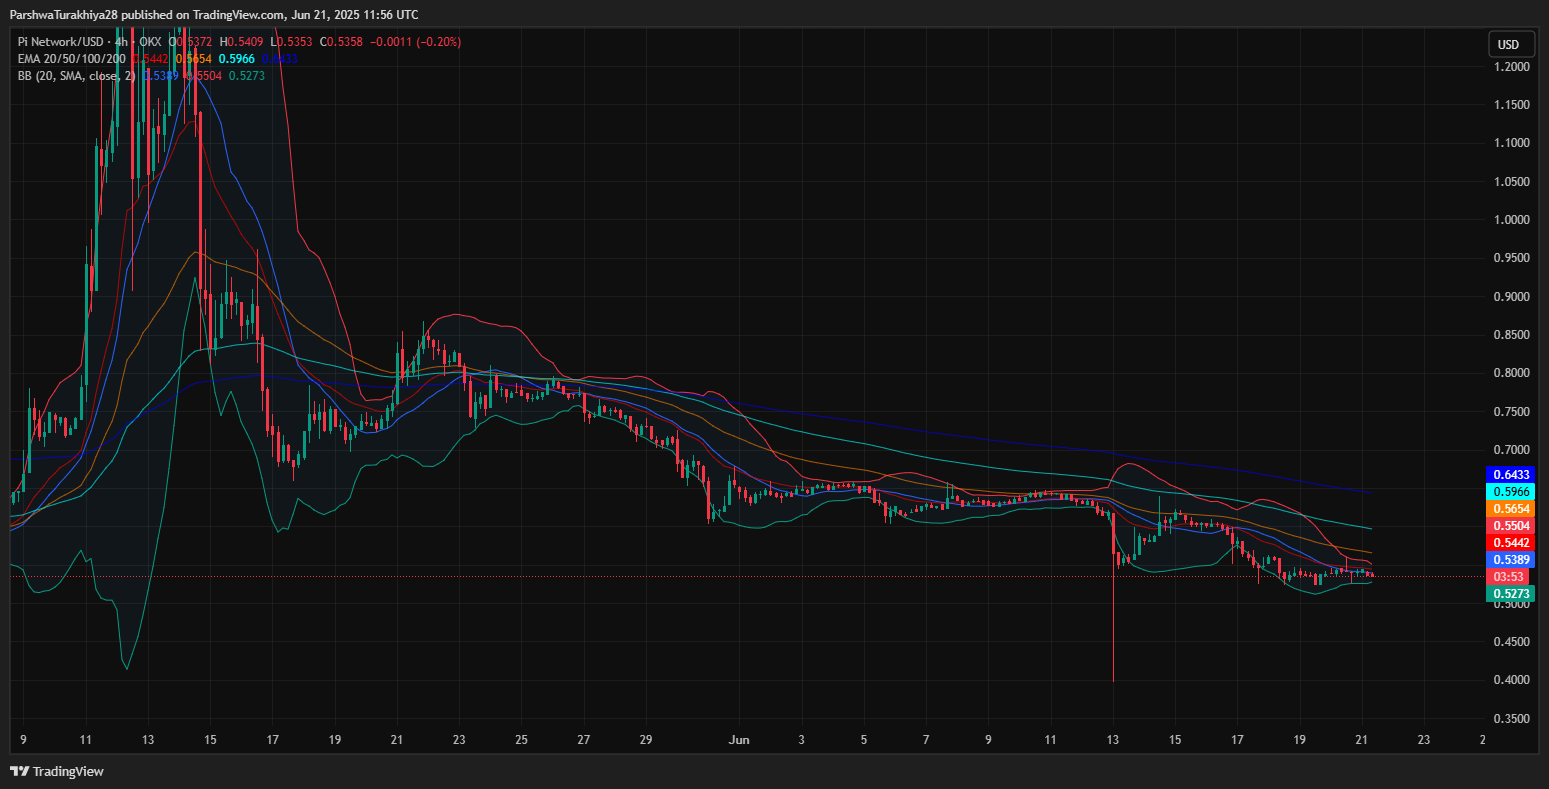
The 4-hour chart shows Pi Network price action trapped between $0.523 and $0.544, forming a narrow range since mid-June. The price continues to trade below the 20, 50, 100, and 200 EMA levels, all aligned between $0.538 and $0.596, signaling sustained bearish control across medium-term trendlines.
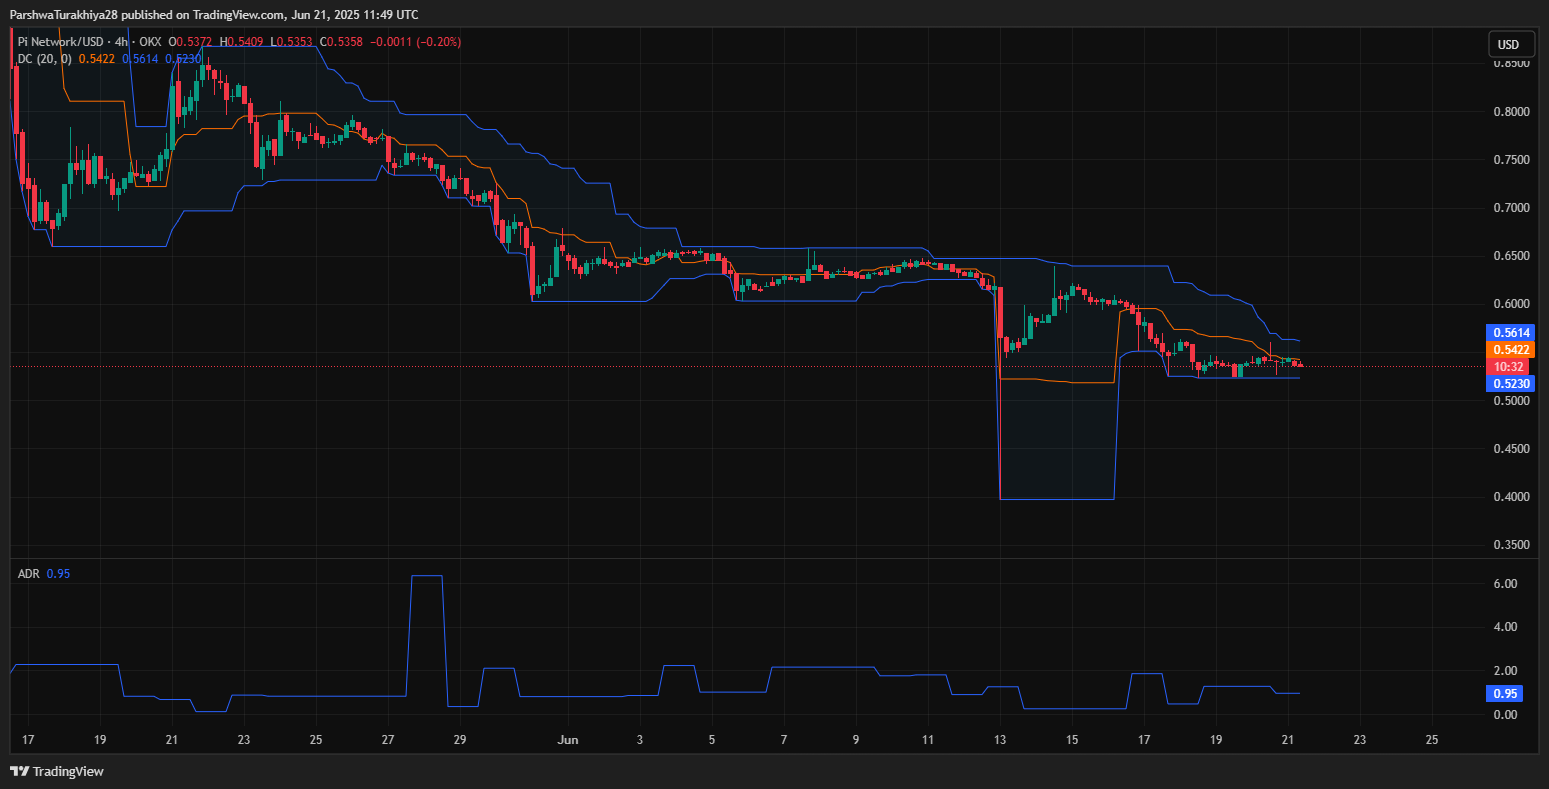
Bollinger Bands on the 4-hour timeframe are tightening rapidly, suggesting a volatility squeeze is underway. Meanwhile, the Donchian Channel reflects similar compression with upper and lower bounds converging near $0.561 and $0.523. This confluence of indicators shows that Pi Network price volatility is likely to expand sharply in the next 24–48 hours.
Short-Term Indicators Reflect Bearish Bias Amid Flat Momentum
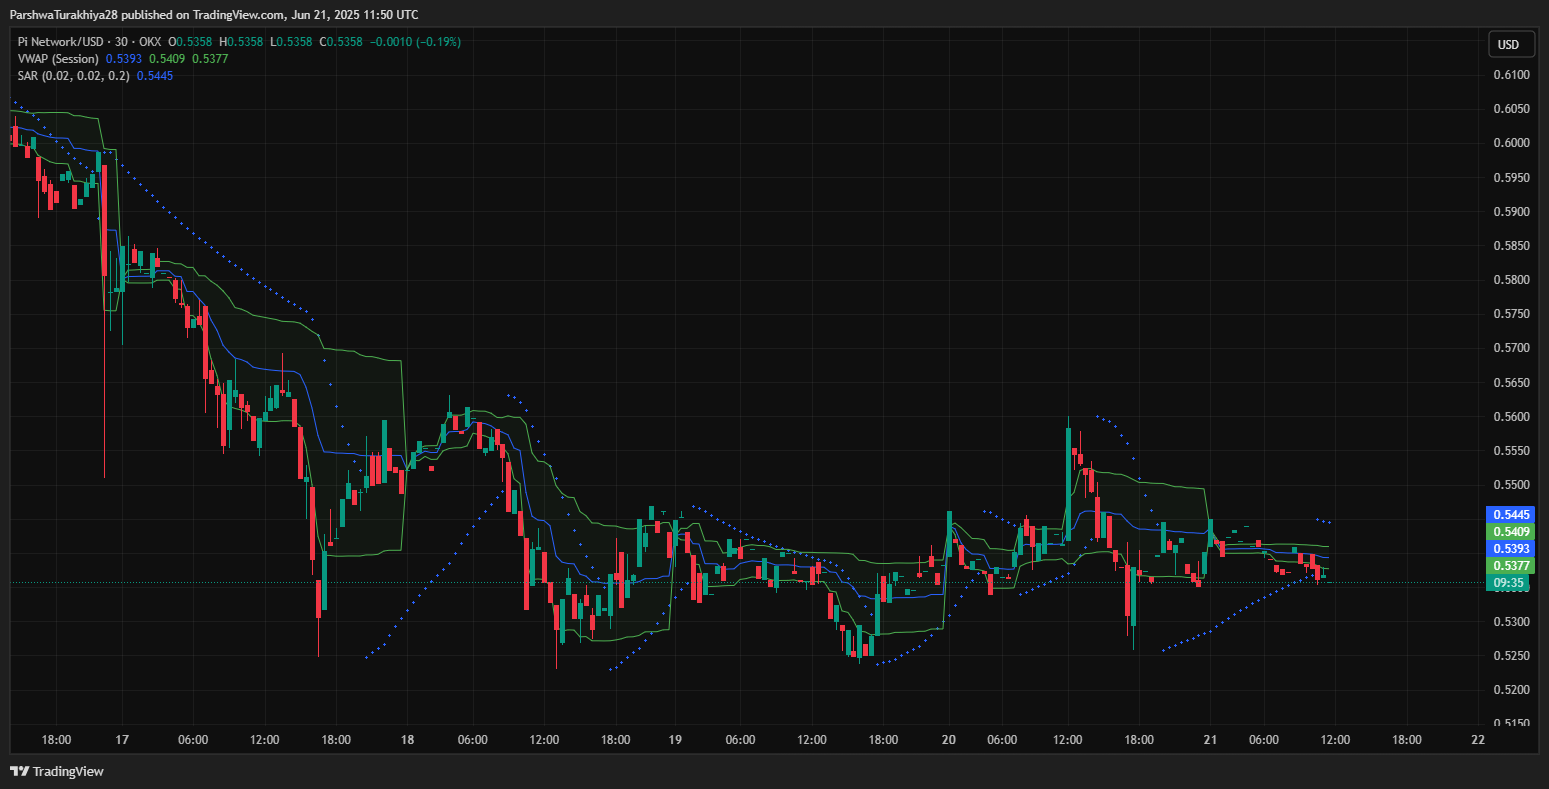
Zooming into the 30-minute chart, the VWAP line rests slightly above the price at $0.539, suggesting bears still dominate microstructure positioning. The Parabolic SAR dots have flipped above the candles, a bearish signal confirming lack of follow-through on minor intraday bounces.
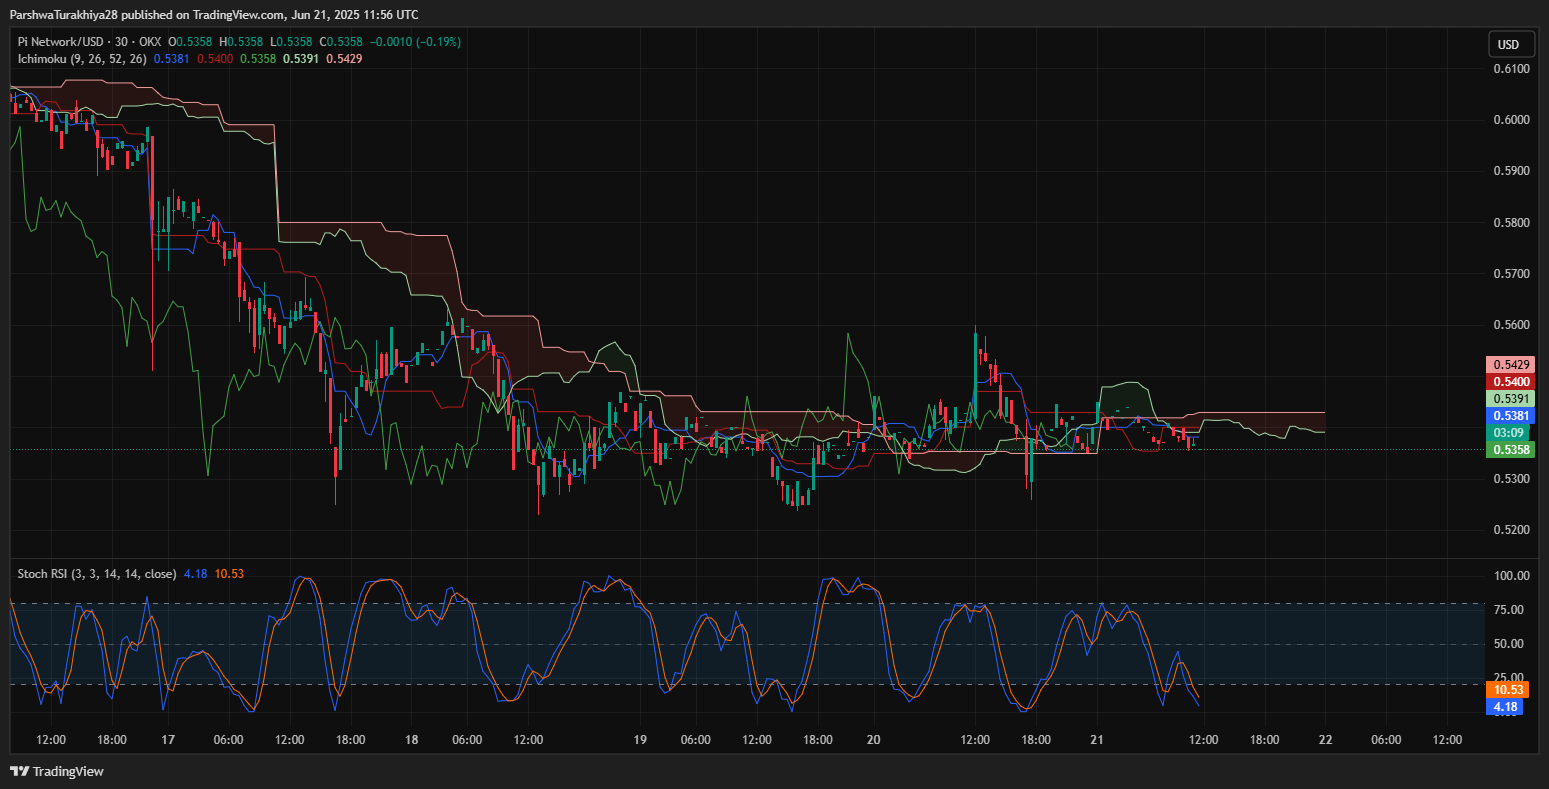
The Ichimoku Cloud on the 30-minute chart shows PI below the Kumo cloud, with a bearish twist in Tenkan-Sen and Kijun-Sen lines. Moreover, the Chikou Span is trailing below price and cloud, reinforcing a weak structure. Price attempted to climb into the cloud twice this week but failed to hold gains — a sign of low conviction among buyers.
Stoch RSI also leans bearish, with the blue line at 4.18 and orange line at 10.53, both in deep oversold territory. However, no crossover is evident yet, implying the market could remain in a grind phase before a bounce attempt materializes.
Why is the Pi Network Price Going Down Today?
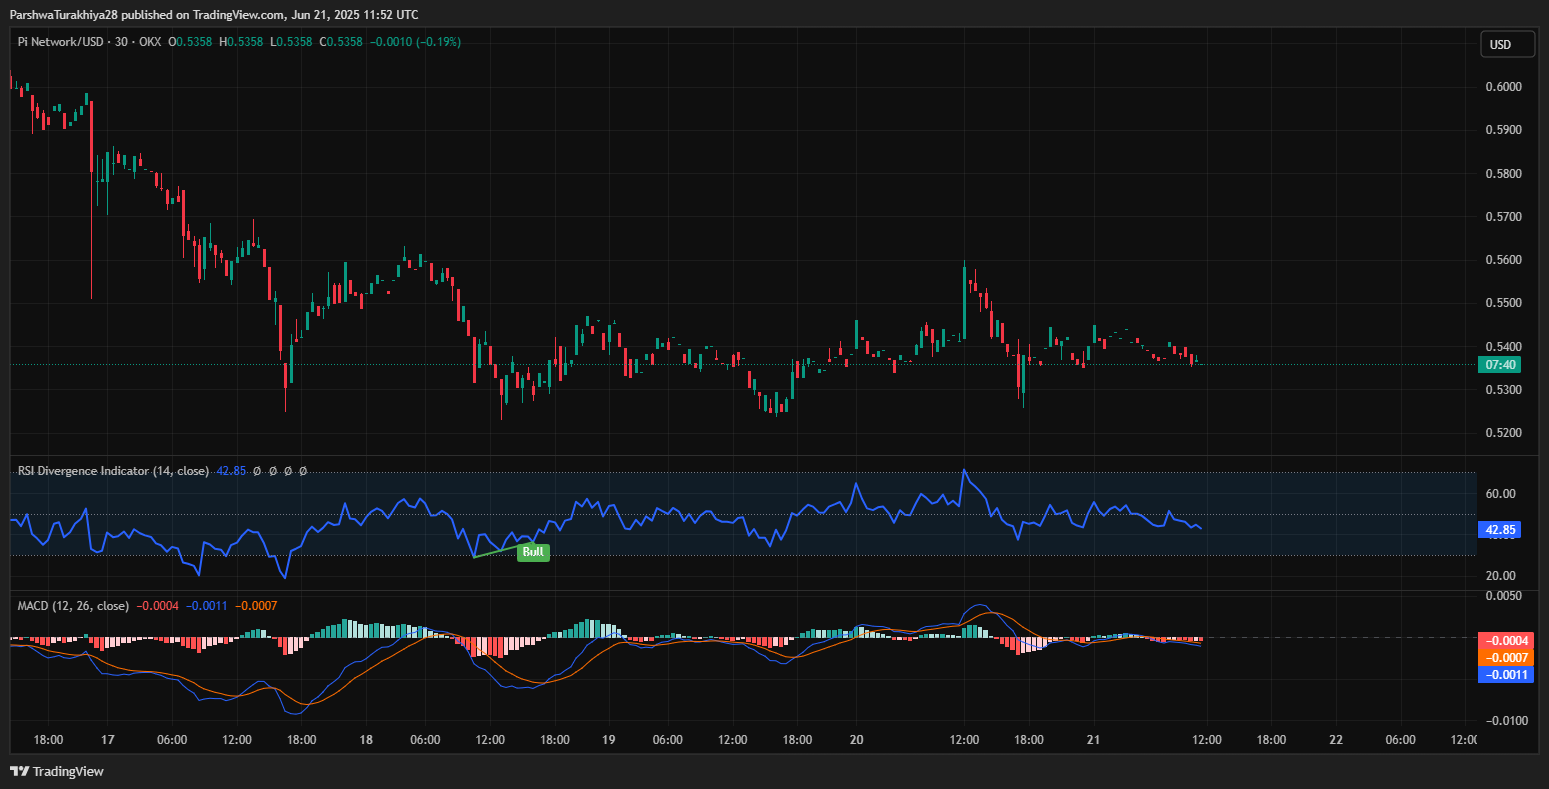
The question Why Pi Network price going down today finds its answer in multiple timeframe weakness and lack of fresh bullish catalysts. The MACD on the 30-minute chart shows a bearish crossover with the histogram stuck near zero. Meanwhile, the RSI reads at 42.85 — below the neutral 50 mark — confirming subdued demand and limited buyer strength in recent sessions.
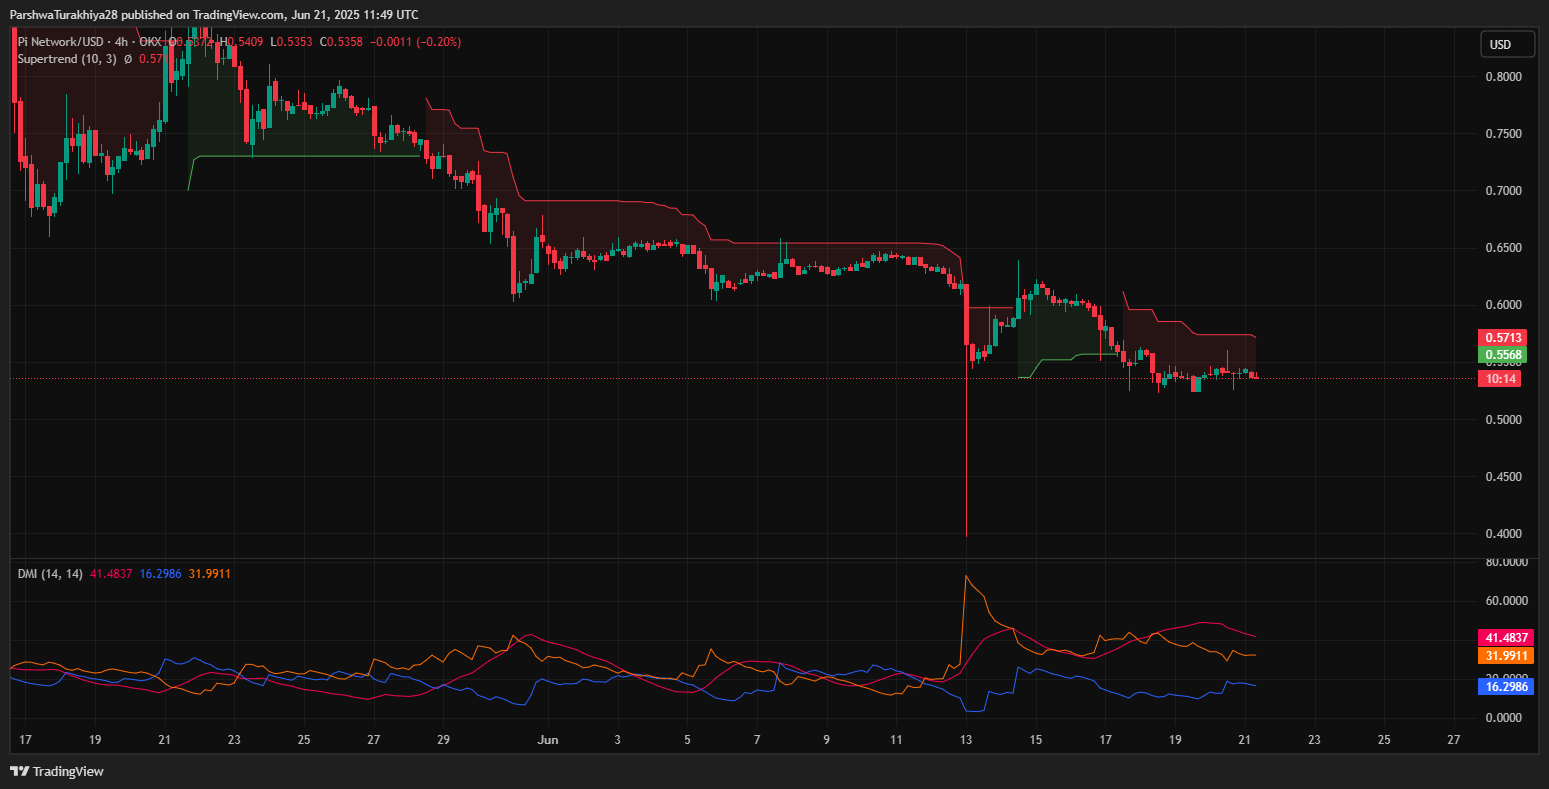
Directional Movement Index (DMI) on the 4-hour chart also paints a bearish picture, with the -DI line (41.48) well above +DI (16.29). The ADX reads 31.99, indicating a strong ongoing trend — currently tilted toward sellers.
This persistent divergence between price and RSI, combined with failed attempts to retest $0.556 resistance, adds weight to the short-term bearish outlook. If bulls cannot reclaim ground above $0.544 in the next session, the risk of a deeper pullback remains high.
Pi Network Price Forecast for June 22
The current Pi Network price update reflects a coiling market with breakout potential. Traders should monitor the $0.544 resistance zone, as a strong candle close above it could pave the way toward $0.565 and then $0.596 — areas aligned with the 50 and 100 EMA levels.
Conversely, if PI closes below $0.523 with volume, it may trigger a retest of the June lows near $0.505. Any slip below this level could accelerate losses toward the psychological $0.480 region, where Pi previously found reactive demand.
Despite the oversold readings on Stoch RSI and flattening MACD histogram, bullish reversal signs are still absent. Traders should look for confirmation via volume spikes or a crossover on short-term oscillators before considering long exposure.
PI Technical Forecast Table: June 22, 2025
| Indicator/Zone | Level (USD) | Signal |
| Resistance 1 | 0.544 | Short-term breakout trigger |
| Resistance 2 | 0.565 | EMA confluence zone |
| Support 1 | 0.523 | Critical range bottom |
| Support 2 | 0.505 | Retest of June lows |
| 20/50 EMA (4H) Cluster | 0.538–0.565 | Still above price |
| RSI (30-min) | 42.85 | Bearish/Neutral |
| MACD Histogram (30-min) | Flat | Low momentum, bearish bias |
| Bollinger Bands (4H) | Tightening | Volatility expansion likely |
| Stoch RSI (30-min) | Oversold | Weak recovery attempts |
Unless bulls reclaim control above $0.544 with strength, Pi Network price may continue trading sideways or face further pressure toward $0.505. All eyes are on volatility expansion as the market prepares for its next major move.
Disclaimer: The information presented in this article is for informational and educational purposes only. The article does not constitute financial advice or advice of any kind. Coin Edition is not responsible for any losses incurred as a result of the utilization of content, products, or services mentioned. Readers are advised to exercise caution before taking any action related to the company.


