
- Pi price today holds near $0.202, facing resistance from EMA clusters and testing a key floor at $0.192.
- Traders weigh Pi’s ISO20022 compliance push ahead of the November 2025 deadline as a bridge to regulated finance.
- Technical outlook shows $0.25 as major resistance, with downside risks toward $0.180 if $0.192 breaks.
Pi price today trades near $0.202, struggling to regain momentum after weeks of selling pressure. The token continues to face resistance from a descending EMA cluster, while buyers are defending a critical floor near $0.192. Traders now weigh whether Pi’s push toward ISO20022 compliance can provide enough narrative support to shift the market’s tone.
ISO20022 Alignment Fuels Long-Term Optimism
The Pi Network community underscored this week that the project is already ISO20022 compatible, positioning itself as part of the financial messaging standard that underpins global banking systems. With a compliance target date of November 22, 2025, Pi is framing itself as a bridge between Web3 assets and regulated finance.
This development could support institutional discussions around Pi’s utility, as ISO20022 is viewed as a requirement for integration into traditional cross-border settlement flows. Yet, the Pi price update shows little immediate reaction, suggesting the market is focused on short-term liquidity rather than long-term adoption milestones.
Sellers Keep Pressure At EMA Cluster
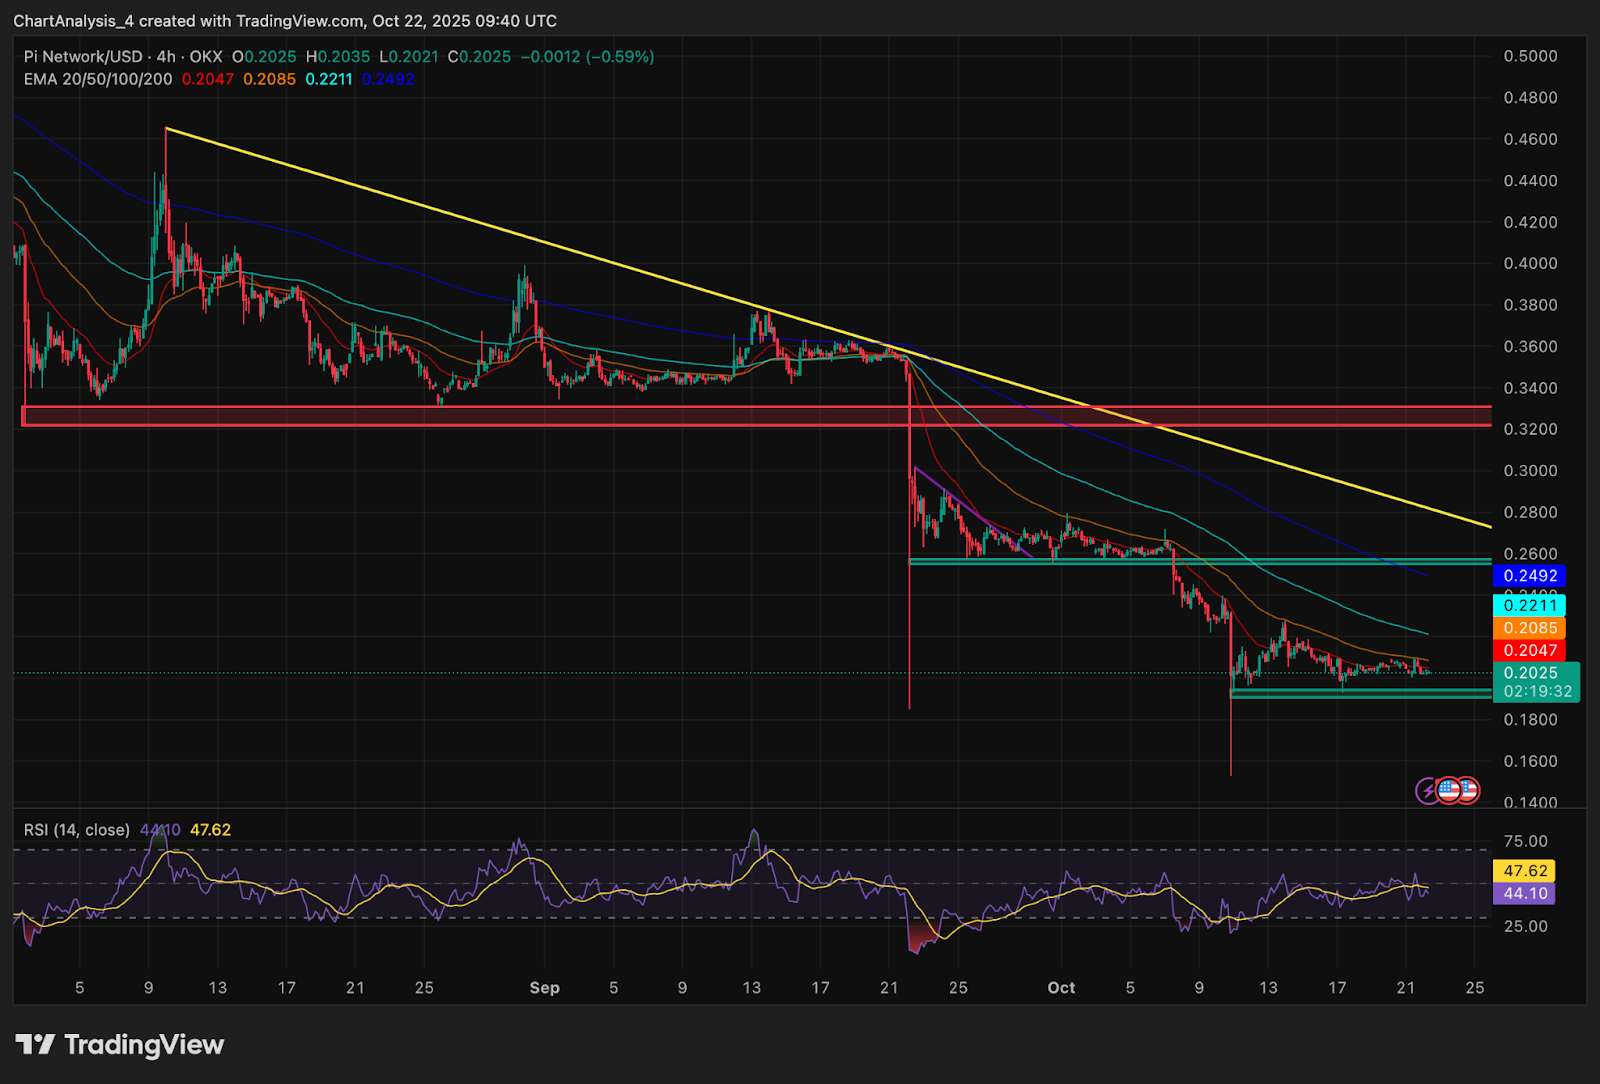
On the 4-hour chart, Pi price action remains capped by the 20–50 EMA range between $0.2047 and $0.2211. Attempts to reclaim this zone have repeatedly failed, keeping the short-term bias tilted lower. A larger descending trendline, extending from early September, reinforces the resistance, with the 200 EMA at $0.249 forming the next ceiling if buyers attempt a breakout.
Related: Solana Price Prediction: SOL Faces Pressure as Hong Kong Approves Spot ETF
Support continues to hold at $0.192, which has been tested multiple times across October. If this base breaks, Pi price prediction models turn cautious, with the next likely target around $0.180. The RSI sits at 47, reflecting indecision, with no momentum shift toward either side.
Daily Chart Confirms Persistent Downtrend
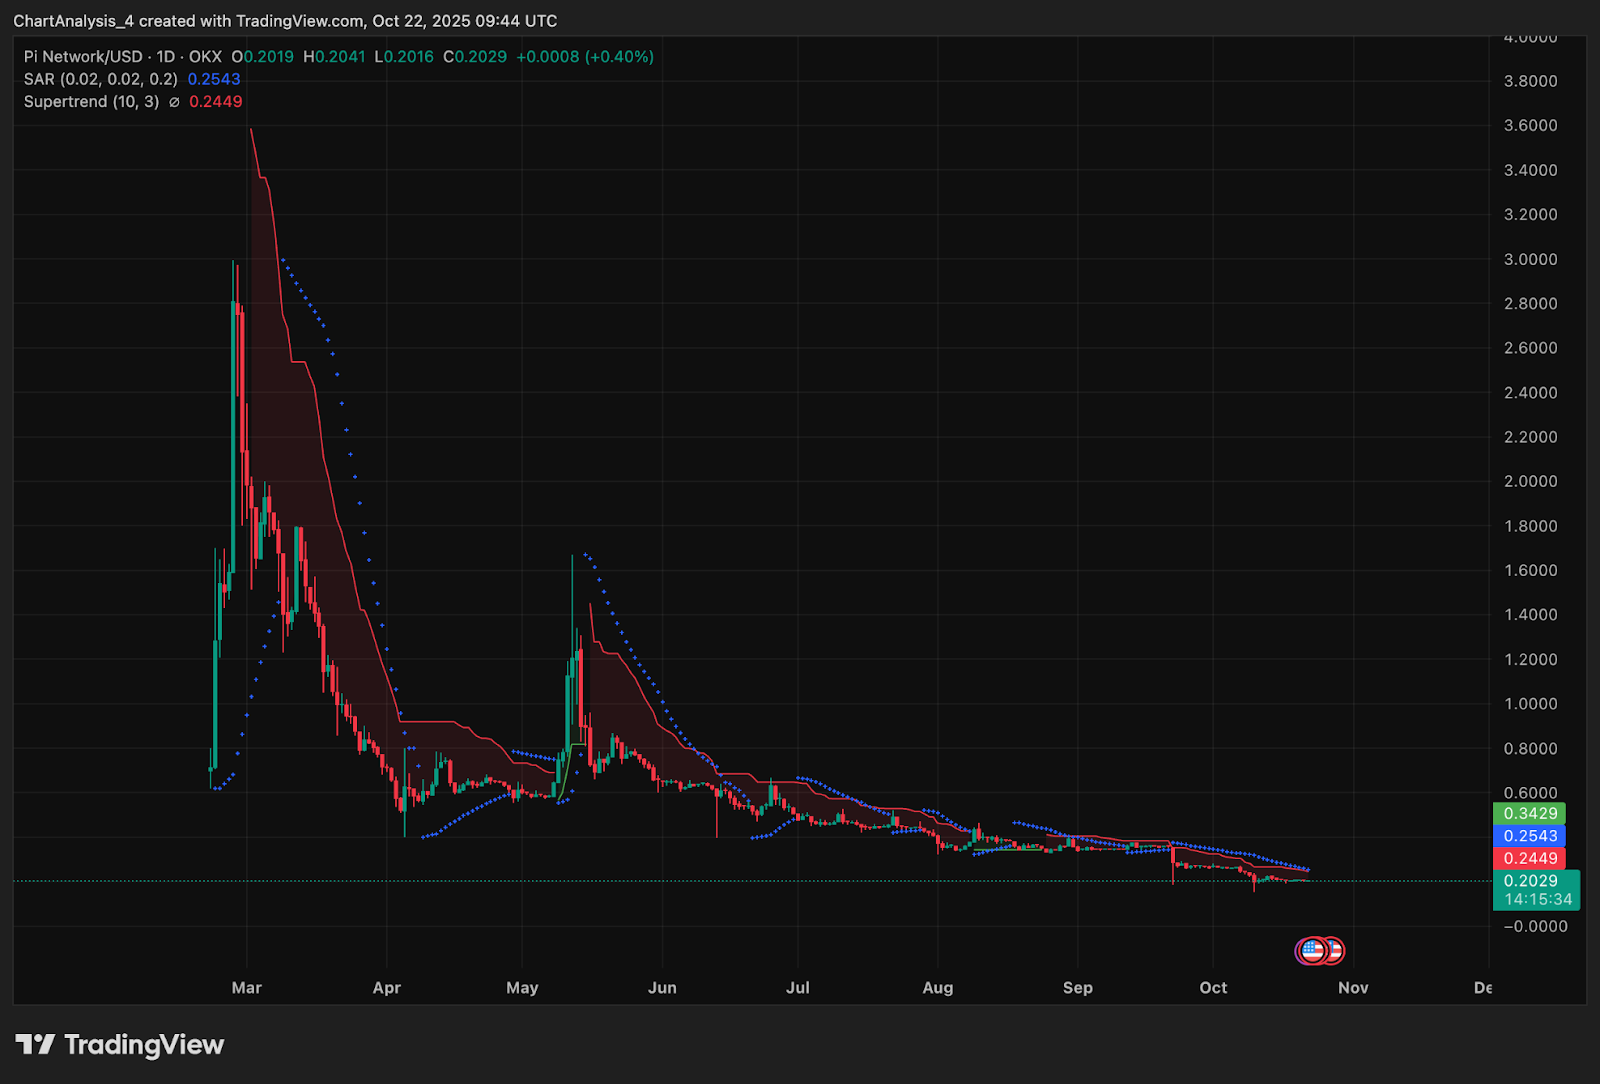
The daily chart highlights how the broader trend remains bearish. The Parabolic SAR continues to print resistance above price, and the Supertrend indicator also signals a sell bias. Until Pi price today reclaims $0.24–$0.26, rallies are likely to be viewed as corrective rather than trend-changing.
Trading volume has also thinned significantly compared to August and September, reflecting reduced participation. Without a pickup in demand or a clear macro trigger, Pi risks extending its consolidation phase rather than staging a sustained recovery.
Short-Term Outlook
On the downside, failure to defend $0.192 could drag Pi coin price toward $0.180 and even $0.165, deepening the bearish structure. Until these thresholds are tested, traders will treat Pi as consolidating rather than trending.
The Pi price update for October 23 remains balanced. Bulls must reclaim the EMA cluster and close above $0.25 to confirm recovery potential, while bears will aim to capitalize on any slip below $0.19.
Disclaimer: The information presented in this article is for informational and educational purposes only. The article does not constitute financial advice or advice of any kind. Coin Edition is not responsible for any losses incurred as a result of the utilization of content, products, or services mentioned. Readers are advised to exercise caution before taking any action related to the company.


