
- Polkadot rebounds to $7.60 before sliding to $7.40, marking a short-term bullish trend.
- DOT trading volume surges by 62.41%, indicating heightened market activity.
- RSI at 53 signals neutrality; MACD shows weak but positive momentum.
Polkadot (DOT) has been in a bullish trend in the last 24 hours after establishing support at the intra-day low of $7.37. Subsequently, bullish momentum drove the price to a high of $7.60, where it met resistance and pulled back. However, during the rally, this price trend fluctuated between this intra-day high and a higher low of around $7.50, forming a short-term ascending channel.
However, as of press time, DOT’s bullish momentum has subsided as the price broke below this channel, exchanging hands at $7.40, a 0.70% surge from the support level. DOT’s bullish momentum was accompanied by increases of 0.05% and 29.96% in market capitalization and 24-hour trading volume, respectively, to $10,63 billion and $185.97 million.
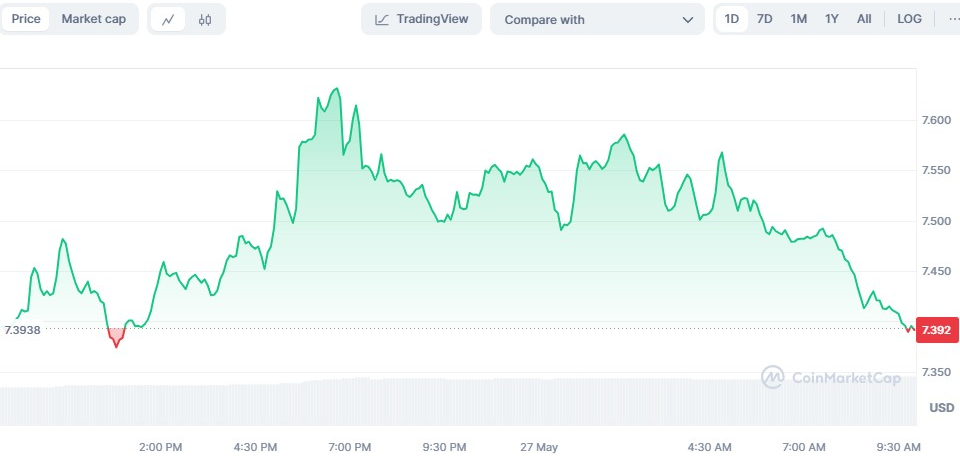
DOT/USD 24-hour price chart (source: CoinMarketCap)
In terms of DOT derivatives data, the bullish momentum propelled the trading volume up by 62.41%, reaching $226.70M. This surge suggests a substantial rise in trading activity and can often indicate strong market interest and potential volatility.
Concurrently, DOT’s open interest has increased by 0.92% to $274.79M. This trend indicates a bullish outlook as it shows that new positions are being opened and that traders are willing to maintain or increase their exposure to DOT.

DOT Derivatives Data: Source: Coinglass
Moreover, while the Rekt data over various timeframes (1h, 12h, 24h) shows higher liquidations on long positions, the substantial long positions held and the higher liquidations can also imply that traders are maintaining their bullish bets despite the volatility. This trend backs the optimism in the DOT market, anticipating a potentially continuing bullish trend.
DOT/USD Technical Analysis
On the DOT 24-hour price chart, a rising wedge pattern that spans from mid-March to May is observed. This pattern is a bearish reversal pattern, which forms when the price consolidates between upward-sloping support and resistance lines. If the trend continues and bulls fail to breach the resistance at $7.81, the consolidation may end with a breakdown below the support at $6.50, potentially leading to a downward price target around the $5.00 mark.
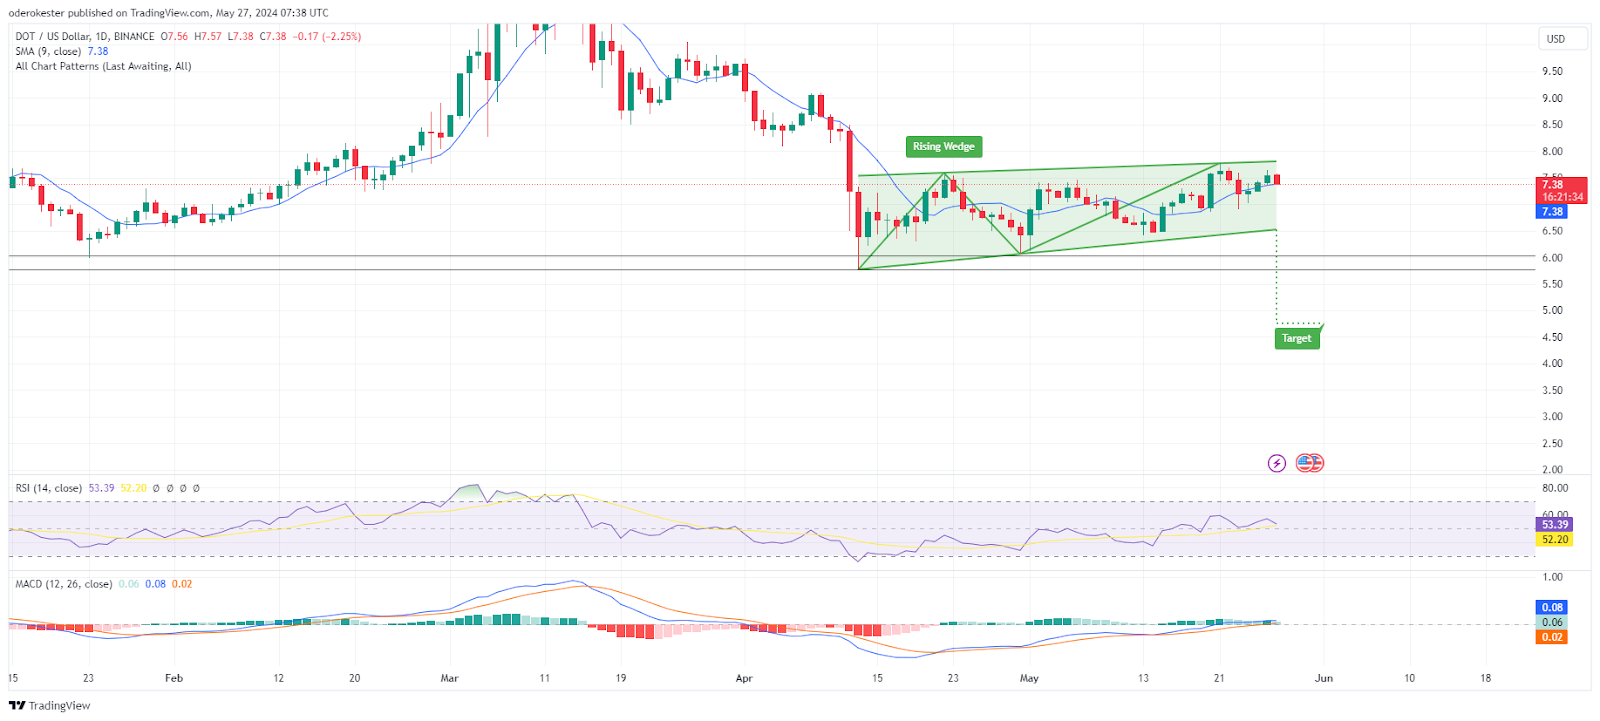
DOT/USD 24-hour price chart (source: TradingView)
The Relative Strength Index (RSI) rating of 53 suggests that the market is neutral, with no particular strength in either the bulls or bears. However, its downward trend warrants caution since it indicates a developing bear trend.
With the Moving Average Convergence Divergence(MACD) trending in the positive region with a rating of 0.08, the bullish momentum is still present, albeit weak. However, the histogram is very close to the zero line, suggesting that any bullish momentum may not be sustainable.
Disclaimer: The information presented in this article is for informational and educational purposes only. The article does not constitute financial advice or advice of any kind. Coin Edition is not responsible for any losses incurred as a result of the utilization of content, products, or services mentioned. Readers are advised to exercise caution before taking any action related to the company.


