
- Polygon (MATIC) tests critical $0.34 support with potential downside to $0.2328 if broken.
- Solana (SOL) shows a buy signal with potential rebound but risk of correction to $0.19 remains.
- Both MATIC and SOL face crucial support levels with market tension reflecting bearish sentiment.
The crypto market has displayed signs of tension with major technical indicators for both Polygon (MATIC) and Solana (SOL) key moments for these digital assets. Crypto analyst Ali Martinez recently highlighted potential price movements based on current chart patterns and technical indicators.
Polygon (MATIC) Nears Critical Support
Polygon (MATIC) is currently testing a support level around $0.34, coinciding with the 1.0 Fibonacci retracement level – a crucial point for traders and investors. Recent price action shows a rejection from the 0.786 Fibonacci level near $0.44, suggesting continued bearish sentiment.
The descending triangle pattern forming on the weekly chart further emphasizes caution, with the descending trendline having been respected multiple times since 2021, solidifying the resistance near the $0.94 level.
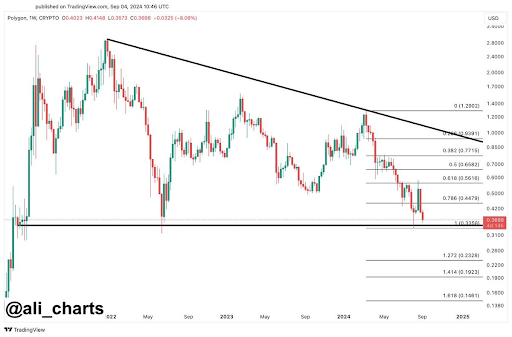
If the $0.34 support gives way, Fibonacci extensions suggest potential downside targets at $0.2328, $0.1923, and $0.1461. However, if MATIC manages to hold above this support, a bounce back to $0.44 could be on the horizon, with the $0.65 level acting as further resistance.
As of the time of writing, Polygon was trading at $0.376176, with a 24-hour trading volume of $234,606,362, placing it at #41 on CoinMarketCap.
Solana (SOL) Eyes Potential Rebound
Meanwhile, for Solana, the TD Sequential indicator has flashed a buy signal on the daily chart, hinting at a possible short-term rebound. Despite this signal, Solana’s price action has been largely bearish, with the asset recently stabilizing around the $132 level after a series of red candlesticks indicated strong selling pressure.
The candlestick chart shows alternating red and green candles, reflecting market indecision as Solana attempts to find its footing.
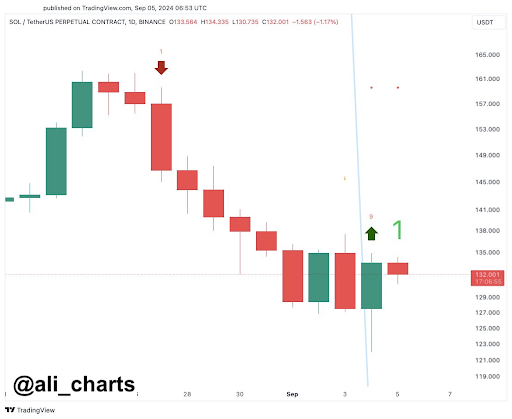
However, if the current support fails to hold, a correction down to $0.19 remains possible. Solana’s current price stands at $133.29, with a 24-hour trading volume of $2,060,035,374, placing it at #5 on CoinMarketCap.
These developments have shown the delicate balance between support and resistance levels for both MATIC and SOL.
Disclaimer: The information presented in this article is for informational and educational purposes only. The article does not constitute financial advice or advice of any kind. Coin Edition is not responsible for any losses incurred as a result of the utilization of content, products, or services mentioned. Readers are advised to exercise caution before taking any action related to the company.
 Price Prediction: XRP Stuck in Tight Range as Traders Watch $1.40 Support")
 Price Prediction: BTC Consolidates as Bulls Eye Breakout Above 72K")

 Price Prediction: Will Bulls Break Above 0.0635?")
