
- Whale activity signals potential shifts in MATIC, with major transfers from Binance.
- MATIC tests $0.378 support whereby breaking below may push price towards $0.375.
- MATIC’s RSI nears oversold, suggesting a potential buying opportunity for traders.
Large-scale MATIC transfers are on the rise as “whales,” or major investors, move significant amounts of Polygon’s native token from major exchanges to unknown wallets. Whale Alert reported several substantial transactions, signaling potential market shifts.
Read also: $8M in MATIC Moved by Polygon Foundation As POL Migration Nears
Binance witnessed two major transfers of 200 million MATIC each, totaling roughly $154.3 million, to an undisclosed wallet. OKEx also saw a notable movement of 30 million MATIC, valued at $11.45 million, to an unknown wallet. Further transfers from Binance and OKEx, involving 200 million MATIC and 30.065 million MATIC respectively, demonstrates the continued whale trading.
MATIC Price and Technical Analysis
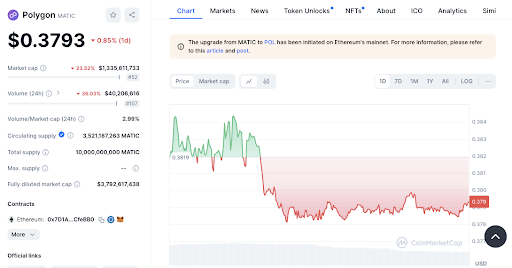
MATIC’s price at press time is $0.3785, reflecting a 1.04% cut down in the last 24 hours. The price has been holding just above $0.378 but is now facing pressure.
Read also: End of Decline for NOT, MATIC, TIA? Key Levels to Watch
In terms of technical analysis, support and resistance levels are becoming clearer. The $0.378 level is providing immediate support as MATIC consolidates. Should this level be breached, the price may fall toward $0.375, which could act as a psychological support point.
Resistance is clear at $0.3819, the recent price high. A sustained move above this resistance could spark a bullish breakout, with the next key resistance level at $0.384.
Market Outlook and Technical Indicators
The overall market sentiment surrounding MATIC seems cautious. Its market capitalization has decreased by 23.66%, suggesting either reduced investor confidence or a decrease in liquidity. Trading volume has also fallen by 35.02% over the past 24 hours, indicating less market activity and the potential for reduced volatility unless new developments arise.
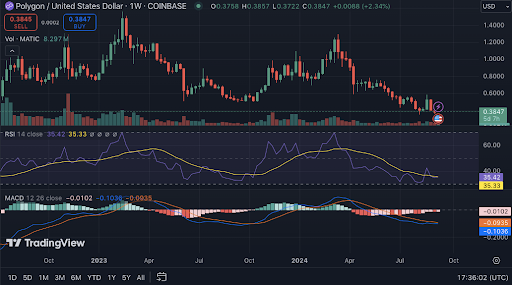
From a technical indicator perspective, MATIC’s 1-week RSI reads at 35.08, placing it close to oversold conditions. This could present a potential buying opportunity for traders seeking an entry point. However, the 1-week MACD is still below the signal line, hinting at continued short-term downward momentum.
Disclaimer: The information presented in this article is for informational and educational purposes only. The article does not constitute financial advice or advice of any kind. Coin Edition is not responsible for any losses incurred as a result of the utilization of content, products, or services mentioned. Readers are advised to exercise caution before taking any action related to the company.
 Price Prediction: XRP Stuck in Tight Range as Traders Watch $1.40 Support")
 Price Prediction: BTC Consolidates as Bulls Eye Breakout Above 72K")

 Price Prediction: Will Bulls Break Above 0.0635?")
