
- PUMP holds key support at $0.00249 as bullish interest fuels consolidation risk
- Trading volume surges 79% to $663.7M, reinforcing market attention on PUMP
- MACD hints at bullish crossover while RSI near oversold suggests rebound chance
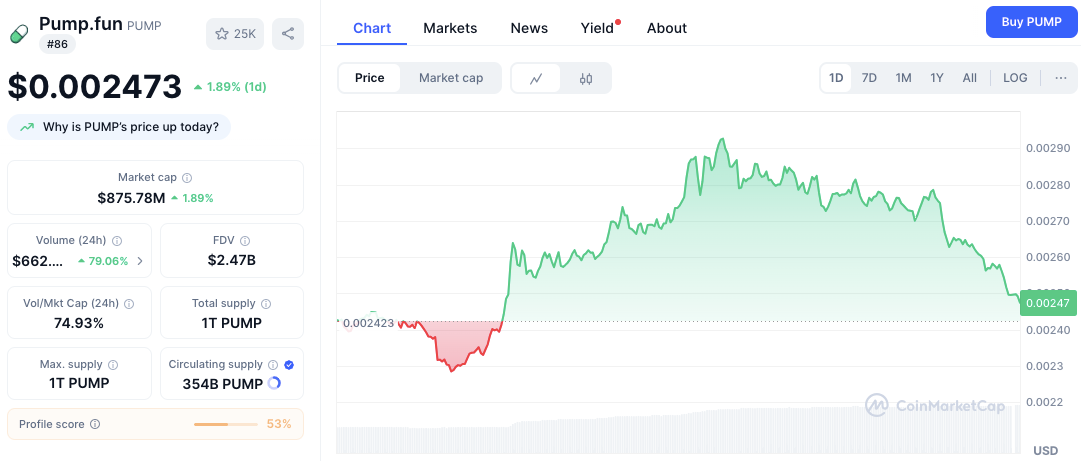
The Pump.fun (PUMP) token displayed an impressive intraday rally, surging to a peak of $0.00290 before retracing to a more stable level of $0.002498, a daily gain of 2.9%.
This movement reflects both heightened interest and active trading in the market, with the token now positioned near a crucial support level.
A 79% volume surge signals growing market interest
One of the most notable factors in PUMP’s recent action is its 24-hour trading volume, which jumped by over 79% to $663.7 million.
This sharp increase suggests growing market participation and highlights PUMP’s presence on traders’ radars. In parallel, the token’s market cap has reached $884.3 million.
Moreover, PUMP’s circulating supply currently sits at 354 billion tokens, which is just over a third of its total supply. This structure means that potential price volatility remains high, especially during speculative rallies or sell-offs.
Related: Solana, Jito Executives Named in Expanded $722M Pump.fun Lawsuit
Key PUMP price levels for traders to watch
Currently, the token holds above $0.00249, a level that has become a near-term support following the pullback. If this level continues to hold, traders could expect a period of sideways action or accumulation.
A deeper correction might occur if it slips below $0.00242, which was the day’s low and marks a more critical support threshold.
On the upside, resistance is seen at $0.00280 and $0.00290. The latter was today’s high, where sellers re-entered the market. Reclaiming these levels could confirm bullish continuation and potentially set the stage for further upside.
Related: Pump.fun’s Daily Revenue Plunges Below $300k, Lowest Since September 2024
Technical Indicators Point to Mixed Momentum

The MACD readings show a narrowing gap between the MACD line and the signal line. Though still negative, the histogram hints at a potential bullish crossover. This pattern may signal a momentum shift if confirmed by follow-through buying.
Additionally, the RSI stands at 42.38, indicating a neutral-to-bearish sentiment. It hovers just above the oversold zone. Hence, a bounce from this region isn’t out of the question, especially if trading volume remains strong.
Disclaimer: The information presented in this article is for informational and educational purposes only. The article does not constitute financial advice or advice of any kind. Coin Edition is not responsible for any losses incurred as a result of the utilization of content, products, or services mentioned. Readers are advised to exercise caution before taking any action related to the company.


 Price Prediction: Bulls Drive Rally Toward $1 After 967% Surge")

