 Price Prediction for July 29, 2025: QNT Rejects $134 as Rally Stalls Near Key Fibonacci Level")
After a sharp multi-week recovery, the Quant price today is facing resistance just under the $134 zone. The asset has rallied from the $100 base to retest its 0.618 Fibonacci retracement near $128.64, but current price action suggests some profit-taking pressure as indicators flash early signs of exhaustion.
What’s Happening With Quant’s Price?
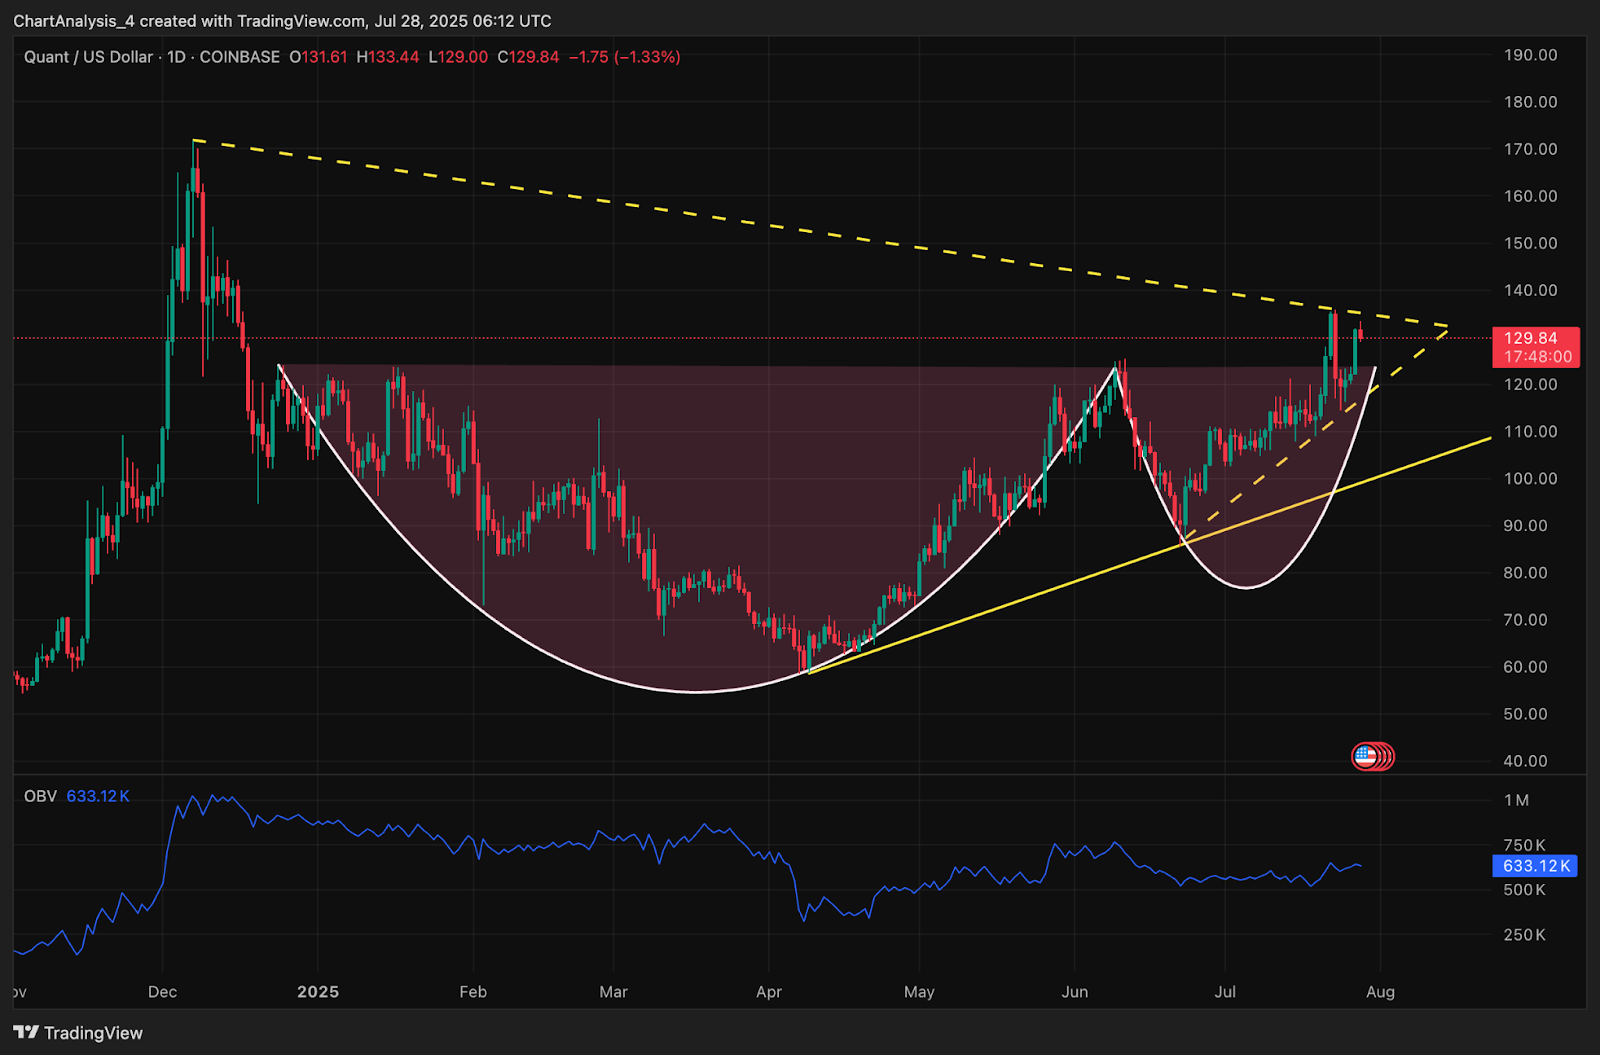
On the daily timeframe, Quant has printed a textbook cup and handle formation that recently broke above the neckline near $122. However, the breakout rally is now struggling to sustain above $133. A rejection candle formed just beneath the diagonal resistance trendline connecting prior lower highs, confirming that buyers are pausing around a historically reactive zone.
The On-Balance Volume (OBV) is showing no aggressive surge, suggesting the current leg lacks the type of buyer conviction seen in earlier breakouts.
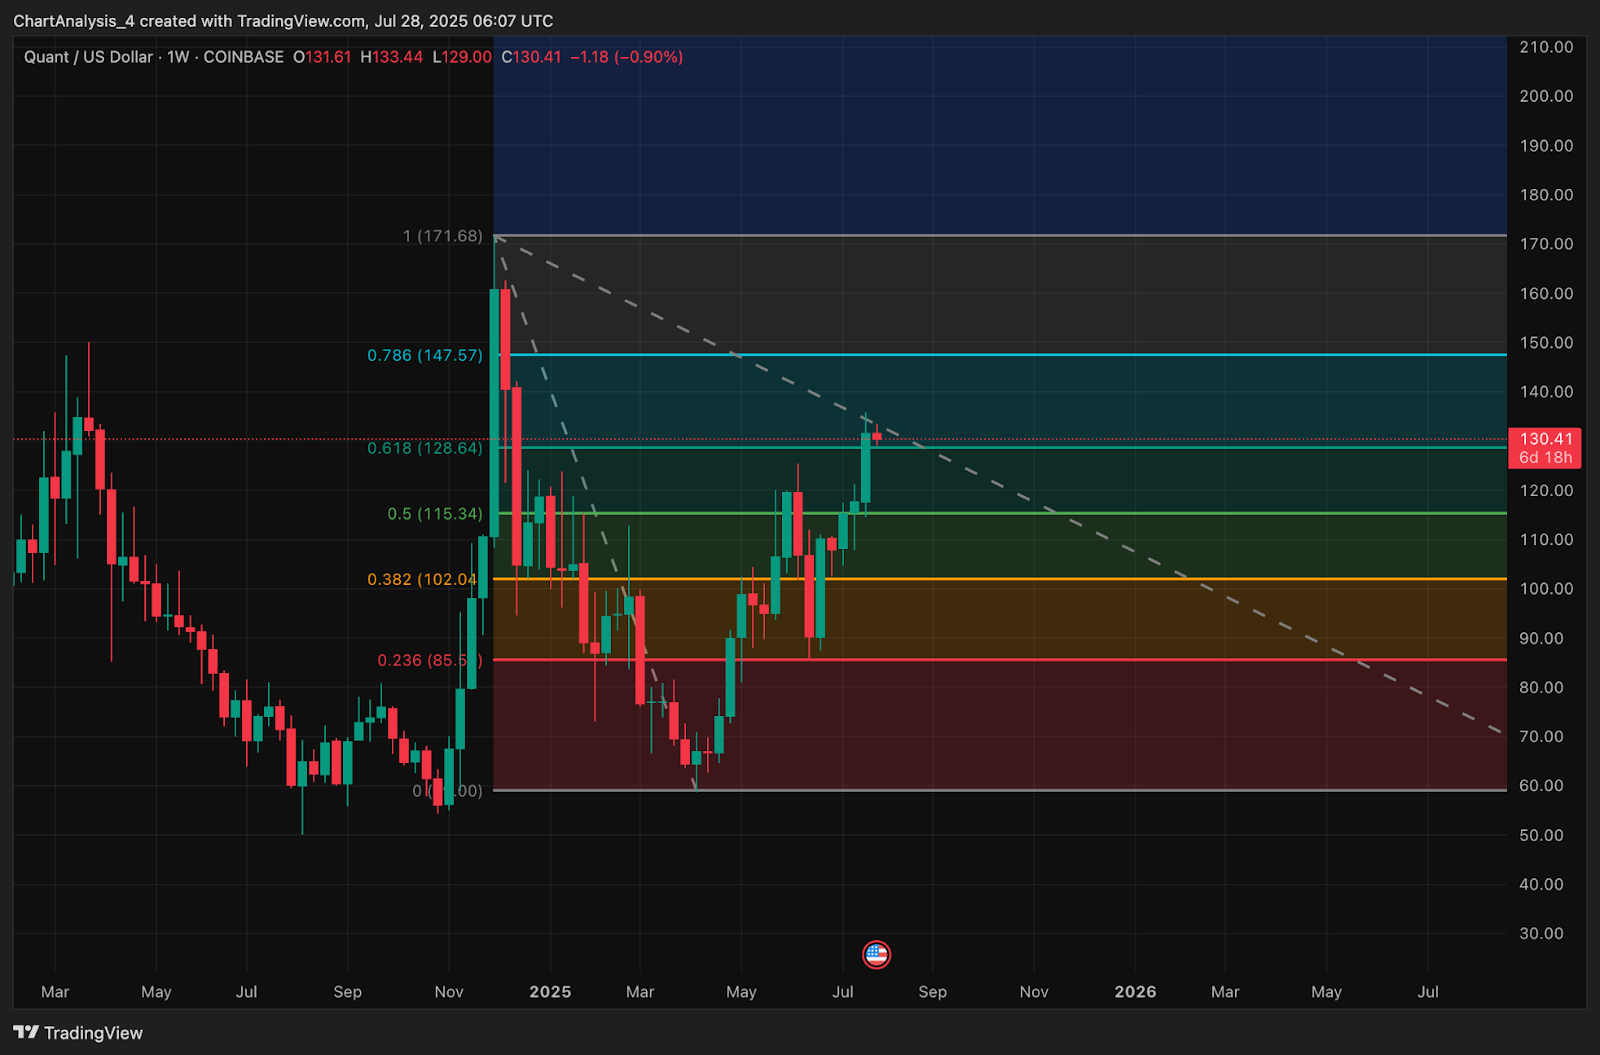
The weekly chart reinforces this hesitation. Price is hovering just above the 0.618 Fibonacci retracement level at $128.64 and has failed to close decisively above it. A clean break through this level would open the path toward the 0.786 Fib zone at $147.57, which remains a long-term upside target. However, current weekly candles are showing upper wicks, suggesting reluctance from bulls.
Why Is The Quant Price Going Down Today?
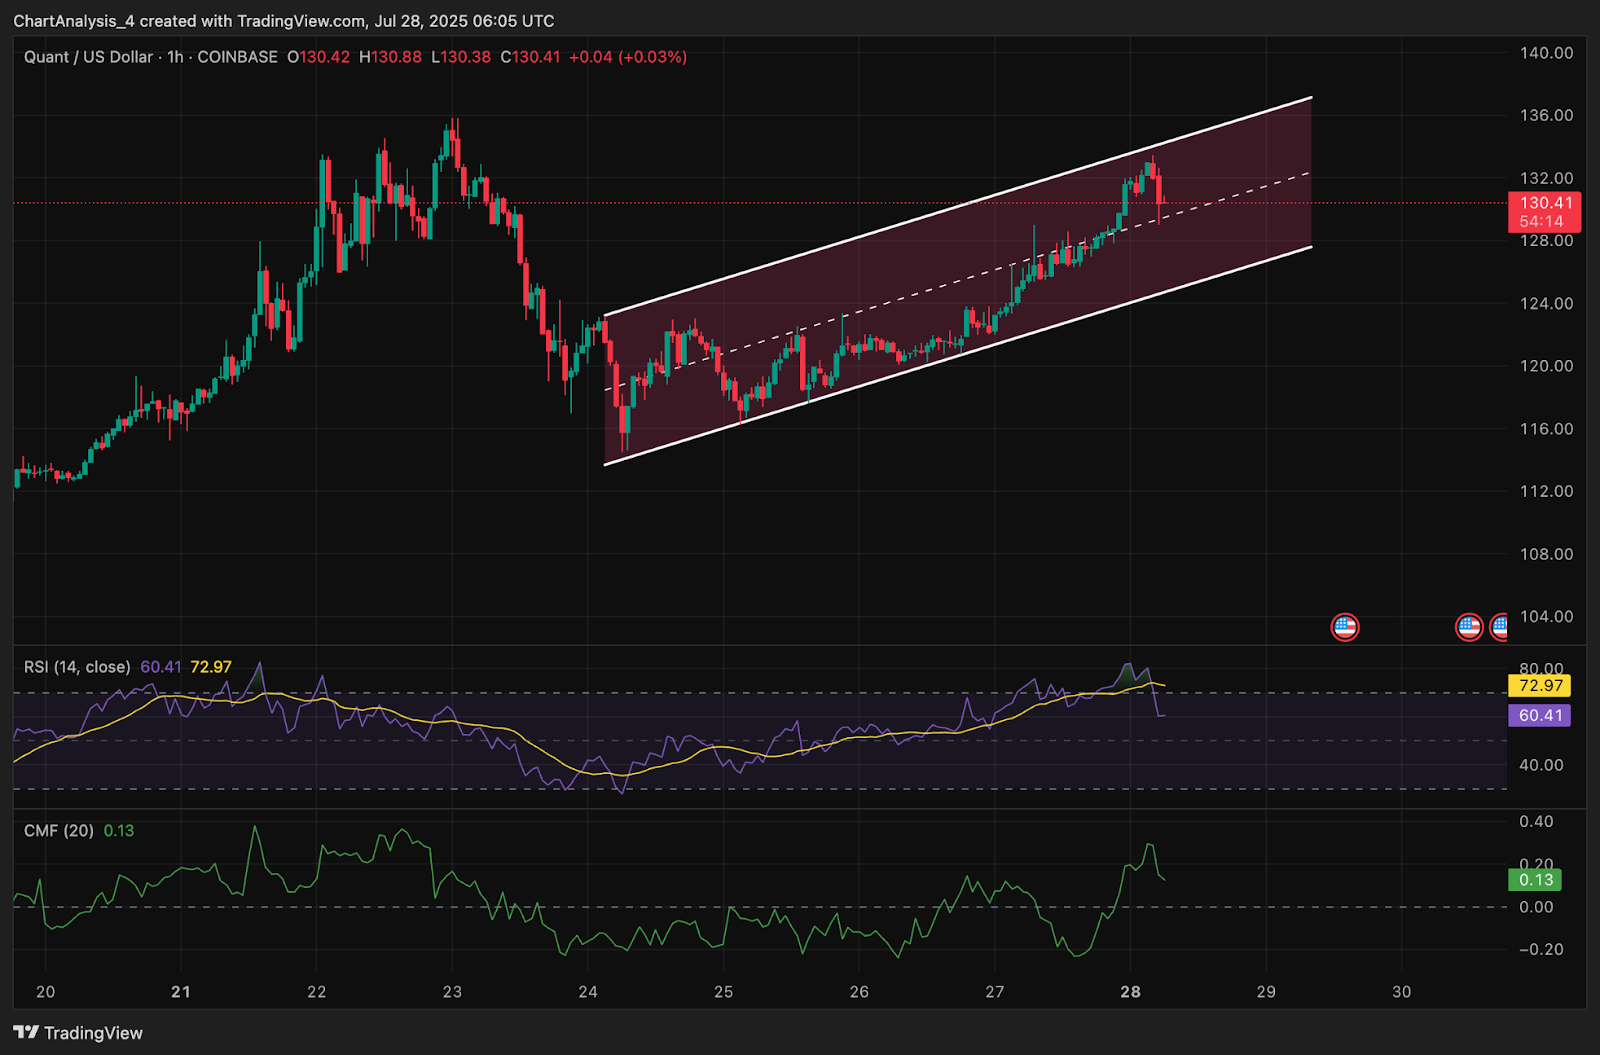
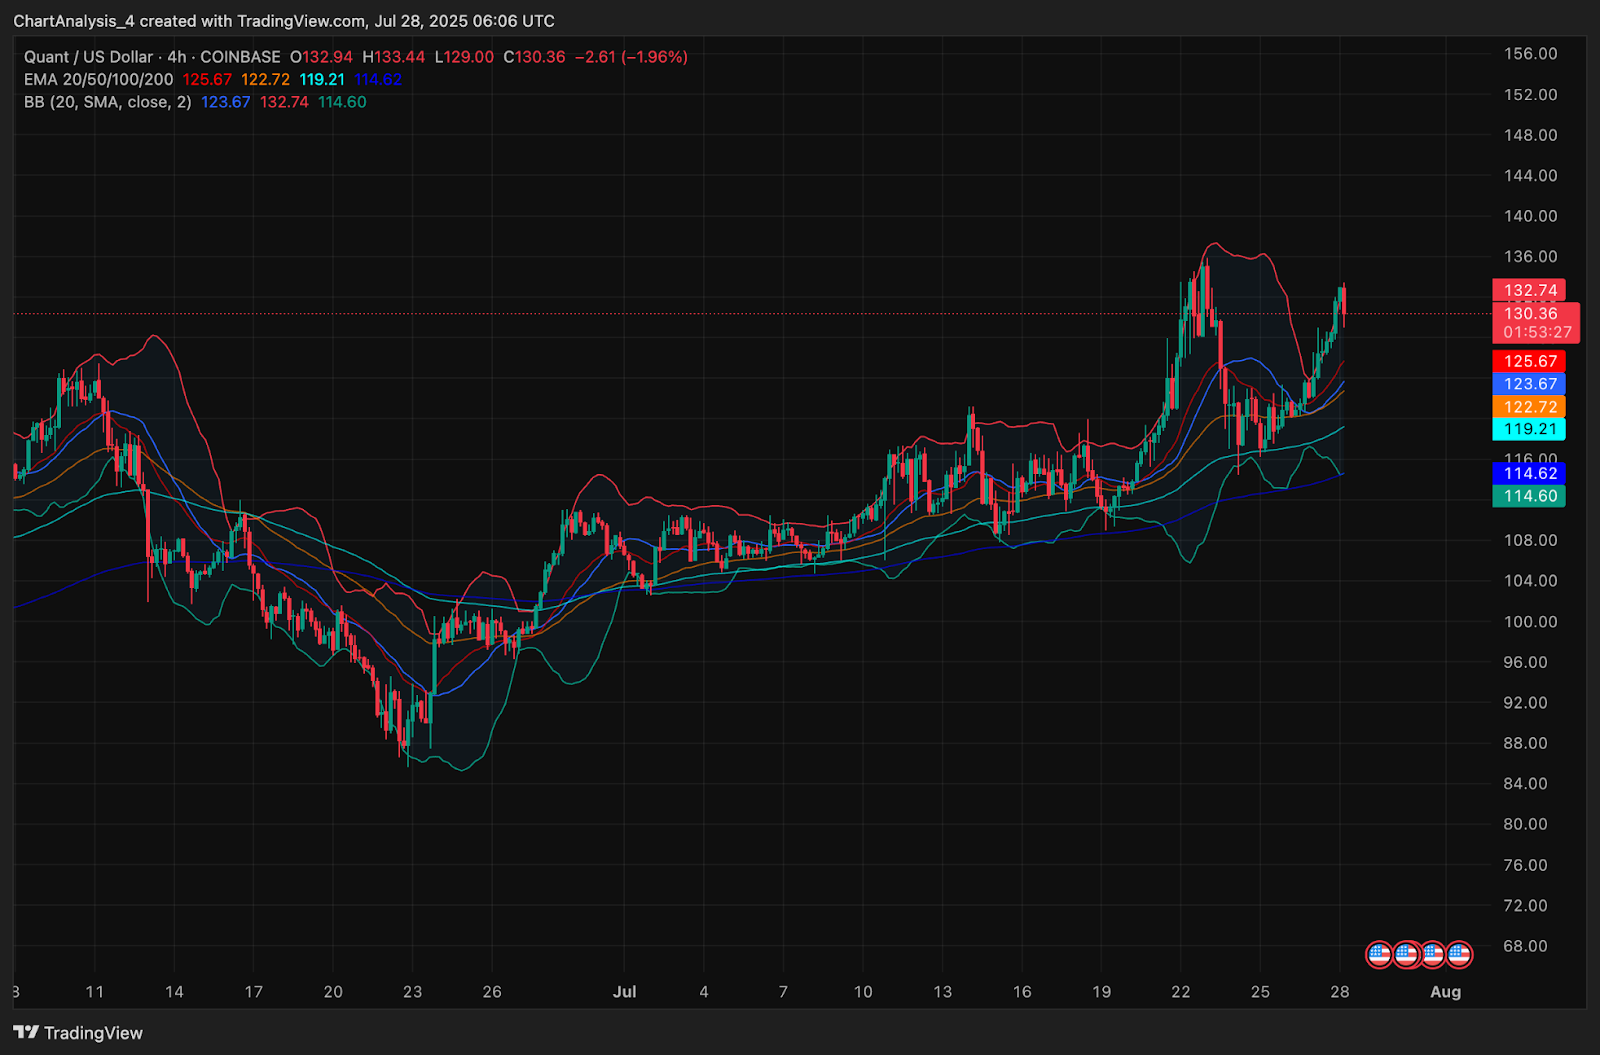
The reason why Quant price going down today appears to be near-term exhaustion after a steep rise. The 4-hour chart shows candles retreating from the Bollinger Band upper boundary, while RSI has cooled off from 73 to 60. Although the trend remains intact, momentum is fading as price enters the midline of its ascending channel. The Chaikin Money Flow (CMF) remains positive at 0.13 but has stopped climbing, indicating that while capital inflows are still net positive, accumulation is slowing.
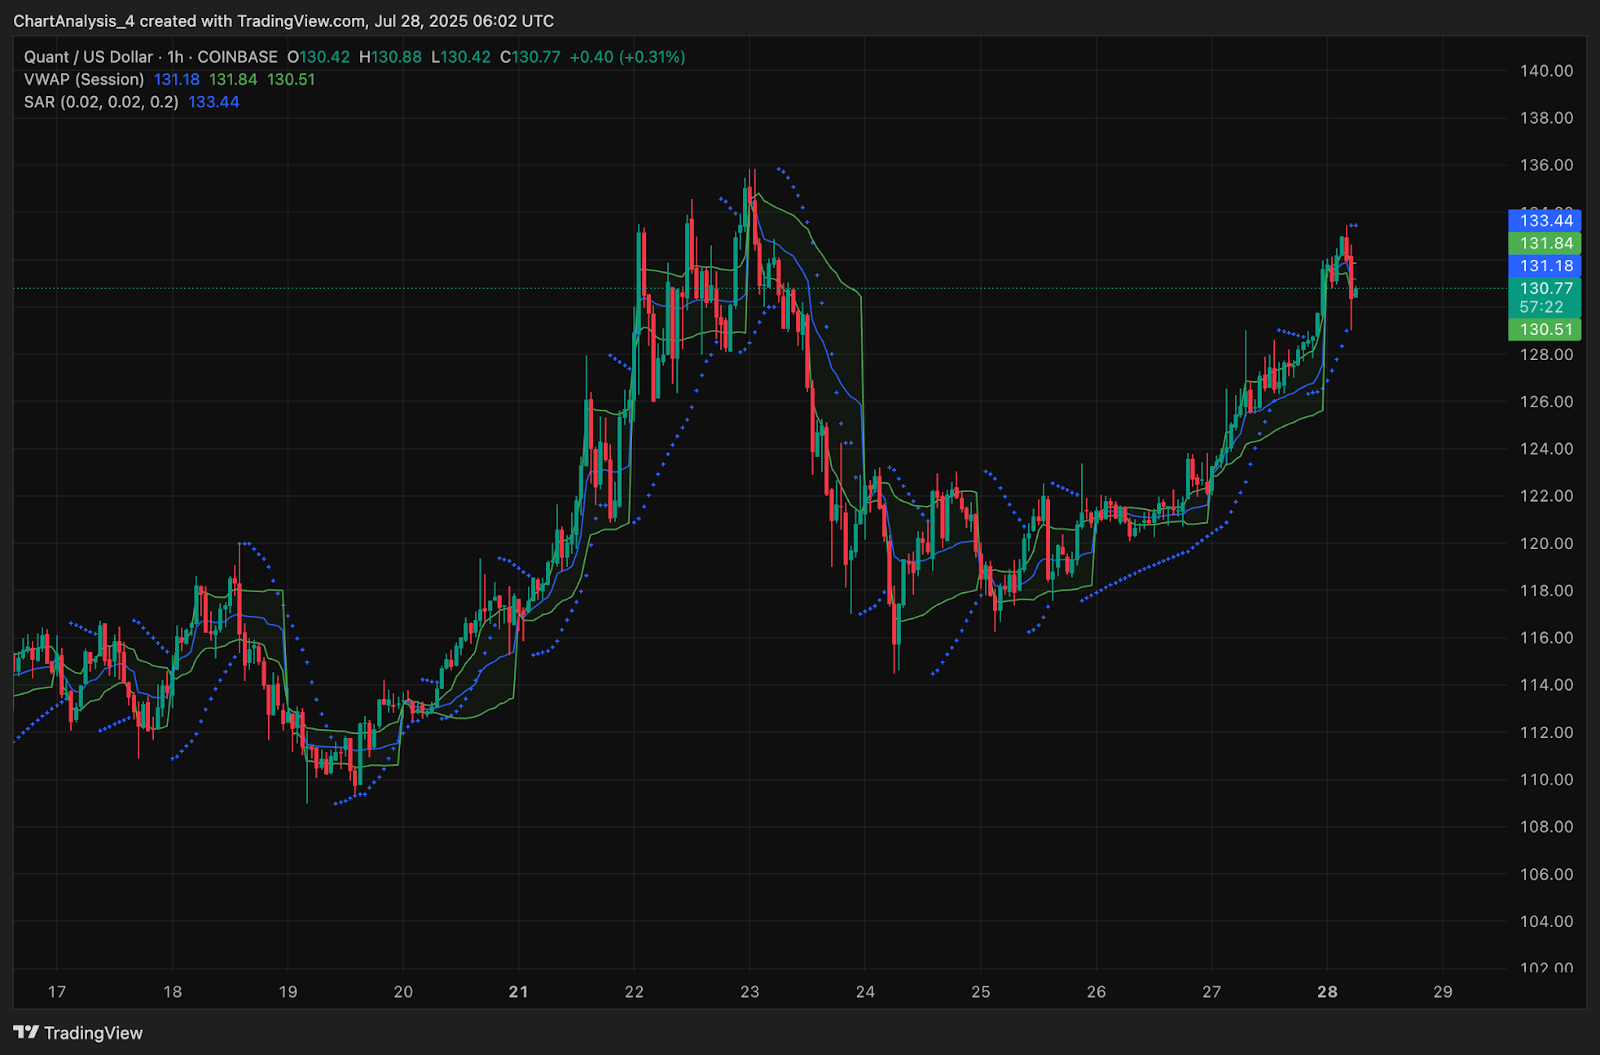
Supporting indicators on the 1-hour chart also reflect this cooling. Parabolic SAR dots have flipped above price at $133.44, signaling short-term selling pressure. Meanwhile, VWAP is sitting at $131.18, and price is now trading marginally below it, suggesting weakening intraday strength.
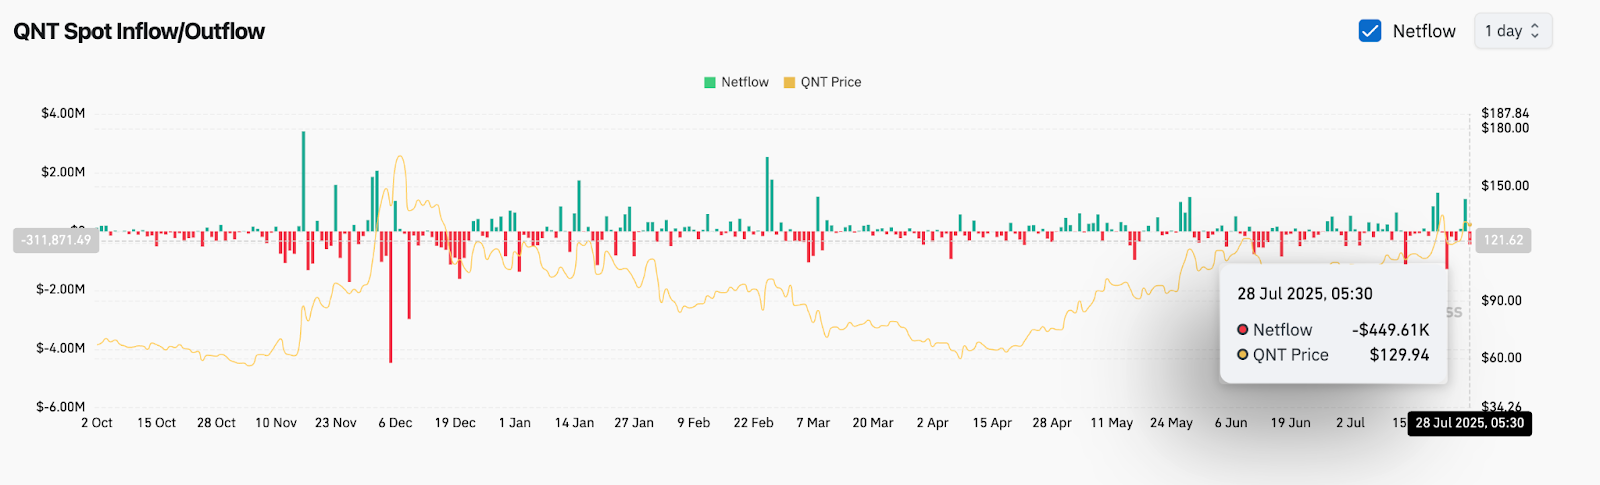
Spot netflow data also shows a minor outflow of $449K in the past 24 hours, reinforcing the slight bearish tilt.
Trend Channel And Indicators Signal Pullback Risk
On the hourly chart, Quant is still respecting its parallel ascending channel that began forming on July 24. Price is now testing the midline after rejecting the upper boundary near $134. As long as the lower channel support near $126 holds, the structure remains intact. A breakdown below this could expose QNT to a retest of $122–$124, where dynamic EMAs are clustered.
The 4-hour EMA ribbon also offers context. The 20 EMA is positioned at $125.67, followed by the 50 EMA at $122.72 and 100 EMA at $119.21. These levels collectively form a support cluster, aligned with the lower boundary of the prior breakout zone. The Bollinger Bands on this timeframe are beginning to narrow, which could be a precursor to volatility contraction or direction reversal.
QNT Price Prediction: Short-Term Outlook (24H)
In the next 24 hours, Quant price is likely to remain in a range between $126 and $134. If bulls can reclaim control and push price above $134.50 with volume confirmation, a breakout toward $140 and $147.50 (Fib 0.786) is possible.
However, if price fails to hold the $128.60 Fib support and breaks below the trend channel’s lower bound, then QNT may revisit $124 followed by $120. These levels also coincide with rising EMA support zones, which could attract fresh demand.
Given the fading momentum, bearish SAR flip, and rejection at resistance, the near-term bias for Quant price today is neutral to mildly bearish unless bulls step back in above $133.
Quant Price Forecast Table: July 29, 2025
| Indicator/Zone | Level / Signal |
| Quant price today | $130.41 |
| Resistance 1 | $134.50 |
| Resistance 2 | $147.57 (Fib 0.786) |
| Support 1 | $128.64 (Fib 0.618) |
| Support 2 | $124 / $120 |
| RSI (1H) | 60.41 (Cooling off) |
| Bollinger Bands (4H) | Narrowing, volatility contraction |
| Parabolic SAR (1H) | Bearish, flipped above price |
| VWAP (1H) | $131.18, price slightly below |
| CMF (1H) | 0.13 (Positive but flattening) |
| OBV (1D) | Stable, no surge |
| Spot Netflow | -$449K (Minor outflows) |
| Trend Pattern | Rising channel and cup-handle |
Disclaimer: The information presented in this article is for informational and educational purposes only. The article does not constitute financial advice or advice of any kind. Coin Edition is not responsible for any losses incurred as a result of the utilization of content, products, or services mentioned. Readers are advised to exercise caution before taking any action related to the company.


