
- Whale activity signals potential SHIB volatility amid rising trading volumes.
- SHIB burn rate drops by 52%, slowing supply reduction and impacting market dynamics.
- SHIB shows consolidation with weak bullish momentum and a neutral RSI indicator.
Shiba Inu has seen a 13.61% increase in trading volume over the past 24 hours. This surge in activity is raising concerns about a potential price breakout as market volatility returns.
Increased whale activity further suggests the possibility of price shifts, as these large holders can significantly influence SHIB’s value. With retail investors and whales exhibiting different trading behaviors, the SHIB market seems to be at a crossroads, trying to find its next direction.
Shiba Inu Burn Rate Drops by Over 50% in 24 Hours
Shibburn data reveals that SHIB’s burn rate has dropped by 52.16% in the last 24 hours. Only 1,200,480 SHIB tokens were burned during this period, a significant decrease from previous days. This slowdown in removing SHIB from circulation could affect the token’s overall supply and market activity.
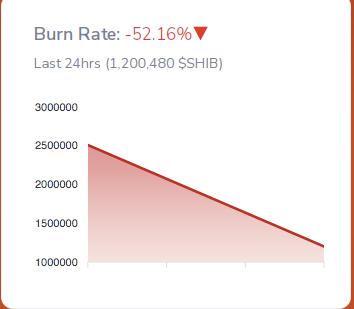
Source: Shibburn
SHIB Price Overview and Current Market Conditions
Despite the recent burn and whale activity, SHIB’s price has dropped. According to CoinMarketCap data, the price of SHIB stands at $0.00001689, down 1.06% over the past day.
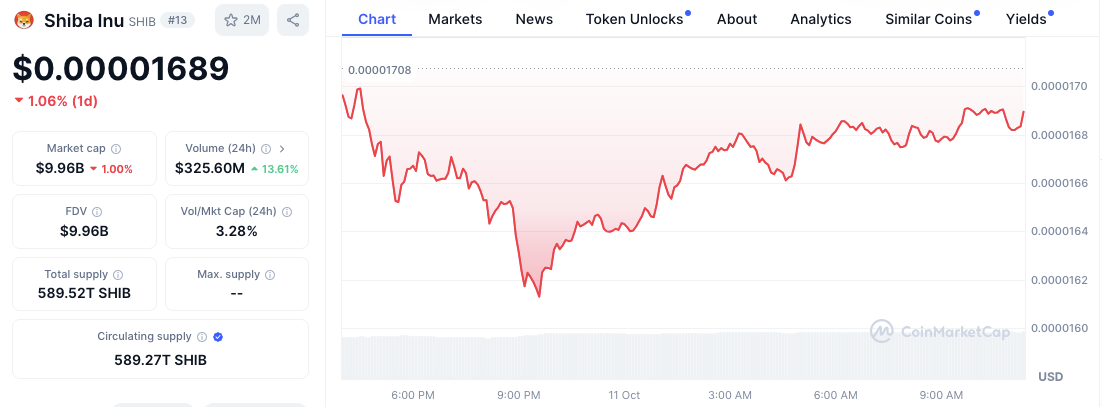
Source: CoinMarketCap
However, trading volume has climbed by 13.61%, reaching $325.60 million over the previous day. The volume-to-market cap ratio of 3.28% highlights the high trading activity relative to the total value of circulating tokens.
Read also : Whale Alert: 1.3 Trillion Shiba Inu Moved to Exchanges in One Day, Price Reacts
Technical analysis reveals that SHIB has experienced some erratic movements, with a sharp spike in early September followed by a period of decline. SHIB’s price has recently been consolidating, with smaller movements observed around the $0.00001688 mark.
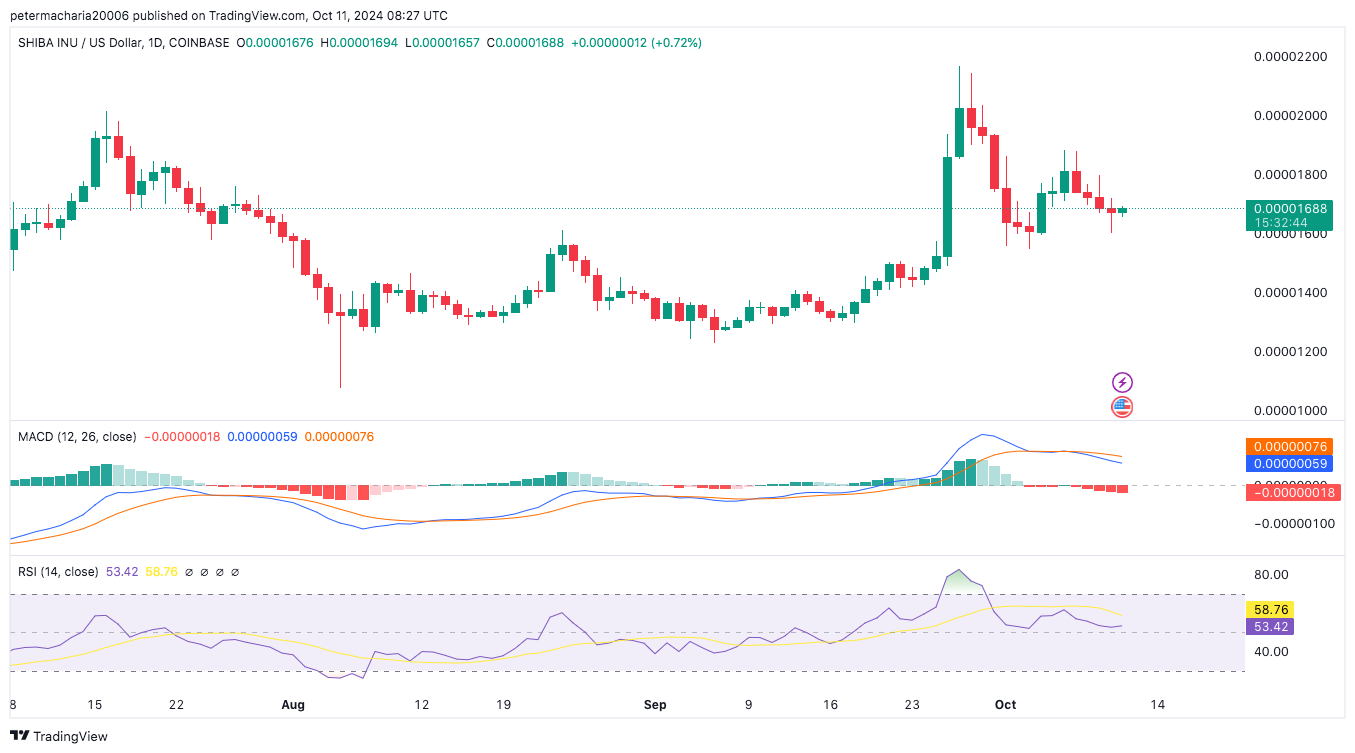
Source: TradingView
The MACD indicator shows weak movement, positioned above the signal line but trending downward. Meanwhile, the Relative Strength Index (RSI) stands at 53.42, which is neutral.
Disclaimer: The information presented in this article is for informational and educational purposes only. The article does not constitute financial advice or advice of any kind. Coin Edition is not responsible for any losses incurred as a result of the utilization of content, products, or services mentioned. Readers are advised to exercise caution before taking any action related to the company.


