
- Analyst Willy Woo warns that Bitcoin’s momentum is in a “mid-cycle slowdown,” evidenced by a weakening MACD.
- He argues the rising U.S. Dollar Index (DXY) is the true gauge of liquidity, signaling a global “shift to safety” that is pressuring risk assets.
- Woo dismisses Global M2 as a “flawed” metric, as it’s distorted by foreign currencies (83%) and housing credit (30-50%).
Bitcoin’s long-term momentum is showing signs of a mid-cycle slowdown. This, according to analyst Willy Woo, is a direct reflection of a strengthening U.S. Dollar Index (DXY). Woo argues that as the DXY rises, it signals a global “shift to safety” that is now pressuring risk assets.
Woo: DXY, Not M2, Is the True Liquidity Gauge
Willy Woo described the DXY as a more practical gauge for investor sentiment than Global M2. He noted that a stronger U.S. dollar, while declining in long-term purchasing power, remains the primary short-term safe-haven asset.
He argues that risk assets like Bitcoin and the S&P 500 tend to move ahead of liquidity cycles, not follow them. They anticipate changes in liquidity. This, Woo suggests, is why both Bitcoin and equities tend to peak before money-supply growth (M2) crests.
Related: US Dollar Index (DXY) Plunge Pushes Bitcoin to $115,000 as Fed Rate-Cut Speculation Heats Up
Why M2 Is a ‘Flawed’ Metric: Housing and Foreign Currencies
Woo also pointed to structural issues with using M2 as a liquidity measure. He noted that only about 17% of Global M2 is denominated in U.S. dollars. The majority is represented by foreign-currency equivalents, making M2 highly reflective of relative dollar strength rather than total global liquidity.
Housing-related credit creation adds another layer of distortion. Roughly 30–50% of new M2 originates from mortgage issuance secured by existing real estate. As long as these funds are tied directly to property valuations, Woo argues, the liquidity generated “does not flow into risk assets.”
The Impact: Bitcoin’s MACD Signals ‘Mid-Cycle Slowdown’
This macro shift is now visible on Bitcoin’s long-term chart. Woo notes that price action resembles past mid-cycle slowdowns. The asset’s most recent candle shows a 7.6% decline.
The decline places Bitcoin below its recent peak but still higher relative to earlier cycles. Beneath the price chart, the MACD histogram indicates a decline in positive momentum.
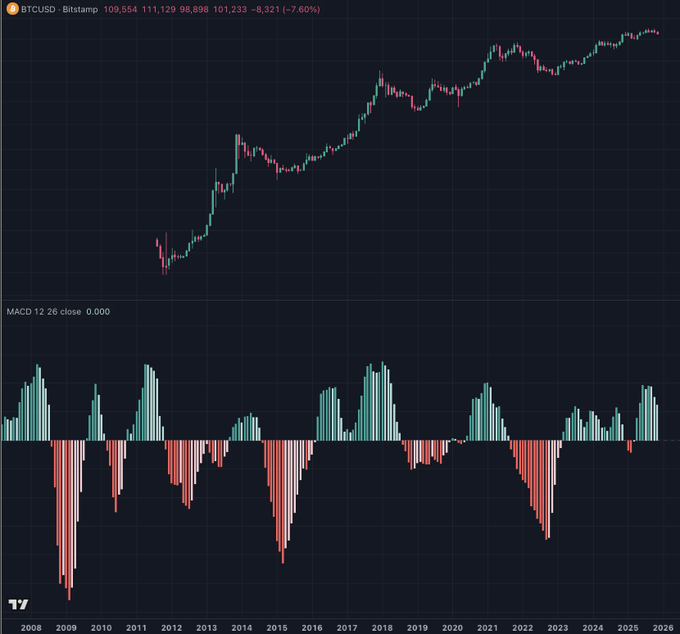
Earlier green bars in 2025 indicated a transition from the negative momentum seen throughout 2022 and 2023. However, the newest bars have begun to weaken, mirroring the mid-cycle pauses recorded in 2017 and 2021.
Related: Bitcoin Price Prediction. Sellers Defend EMA Cluster As Fed Divide Keeps Bulls On Edge
Disclaimer: The information presented in this article is for informational and educational purposes only. The article does not constitute financial advice or advice of any kind. Coin Edition is not responsible for any losses incurred as a result of the utilization of content, products, or services mentioned. Readers are advised to exercise caution before taking any action related to the company.


